A month of technical work and side quests.
Deviations, Sidetracks, and Priorities
It seems July just slipped by. Unlike the past two fast-paced months packed with travelling to conferences and leading meetings, July seemed quite monotonous. Work was mainly centred around the White Nile flood prediction project, which has been creeping along with irritating delays and technical complications. Though progress has certainly been made, I’m slightly concerned I may have been too ambitious in my planned timeline. Given the potential stakes of the project (possibly impacting aid allocations, relocation recommendations, and budgeting), I want to be absolutely certain that the model performs as best as possible.
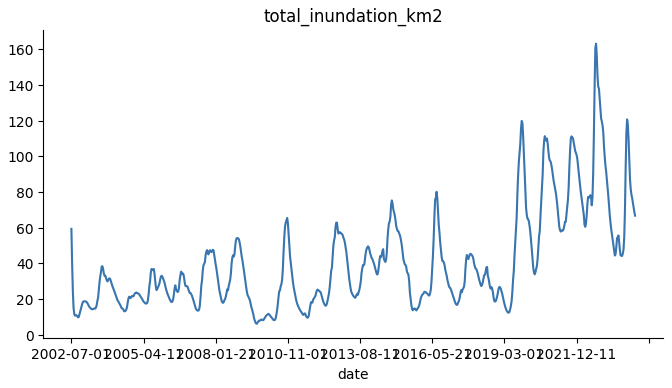
Currently, the Sudd basin is flooded much more than normal in a way that no model was able to predict. Could we build a model that can predict these kinds of extreme events without any equivalent samples in the training data?
The primary challenge of the data is that the issue we are trying to model (extreme flooding events) may not have occurred yet. While the Sudd basin has been inundated beyond normal levels for several years, the current flood situation is unprecedented and was not predicted by any existing models. So the question at hand is: if a similarly unprecedented situation were to occur several years from now, could we build a model that could predict it?
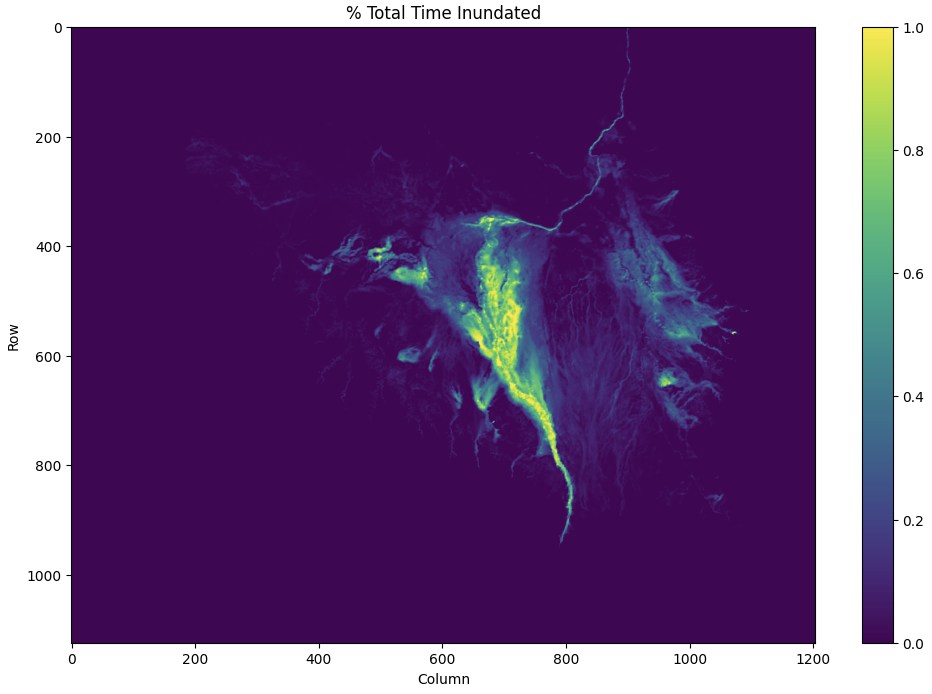 The prediction challenge is that while some areas of the basin are always inundated, there are a very small portion of crucial areas (mainly refugee camps and other human settlements) that are flooded, but only very rarely.
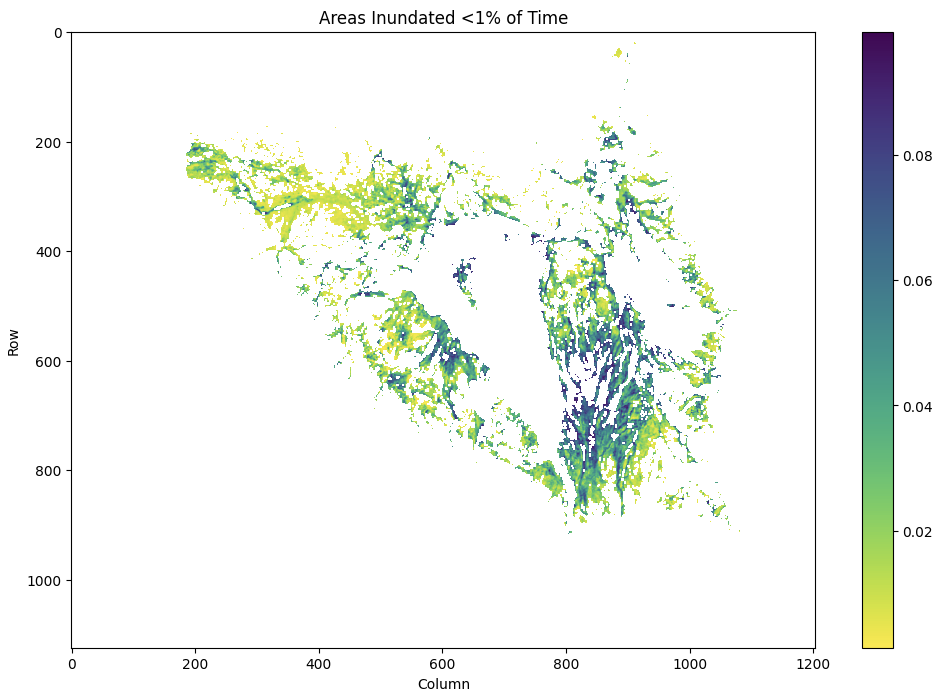 A model that can predict when these areas will be inundated would be instrumental in allocating aid. In addition, aid agencies are interested in knowing when/why the current high levels of flooding will dissipate.
Most of the work so far has been on irritating raster transformations, spatial compression, and parallelisations to make the data usable and the model runnable. Now that this part is now decidedly out of the way, and I can focus on optimising the model (2D ConvLSTM with additional fully-connected components for stationary and non-spatial time series data) to perform well on out-of-sample extreme values. Definitely easier said than done, as neural networks fundamentally struggle with extrapolation beyond values present the training set (though they can fit exceptionally well to data that resembles the training sample, hence their appeal). The plan currently is to test a large number of potential solutions and further develop the best performing method. These include:
-
Hierarchical models, where one model is trained on non-extreme data, one on extremely low data (drought), and one on extremely high data (flood); an additional model is used to determine which model should be used to issue the prediction, as proposed by Li, Xu, and Anastasiu (2023) in An Extreme-Adaptive Time Series Prediction Model Based on Probability-Enhanced LSTM Neural Networks
-
Quantile neural networks, where pinball loss is used during training to natively produce estimates of different quantiles, providing a better understanding of uncertainty
-
Linear-based gradient constraints, where the gradient descent process is restricting such that the neural network forms near-linear associations between variables (this helps with overfitting, but may render the complexity-modelling benefits of neural networks moot)
-
Extreme value loss, where the loss function is set to punish inaccuracies on extreme values substantially more than equivalent inaccuracies on average values
-
Multi-model ensembles, where the outputs of neural networks are combined with other models like tree-based methods or quantile regression, which may be more capable of extracting relationships beyond those present in the training data
Testing extreme values will be done by excluding the current flooding situation completely from the training data and testing to see which models are best at predicting it.
While working on this project, I was briefly distracted by an email from Michael Markrich, an environmental reporter from Hawaii who had heard of my work through Reddit and wanted me to answer some questions about hydroelectric power data and run some analysis on the relationship between Hawaiian wildfires and invasive eucalyptus growth. I ended up spending one weekend modelling the relationship between different Hawaiian vegetation types and historic wildfire perimeters, controlling for a few climate indicators (mainly the Oceanic Niño Index and sea surface temperature anomalies). In short, he ended up being (somewhat) correct that areas with vegetation indicative of eucalyptus groves was more likely to have had wildfires than native forests, but introduced grass and shrub lands were far far more wildfire prone. It seems that any effective strategy to reduce Hawaii’s wildfire risk should focus on these areas.
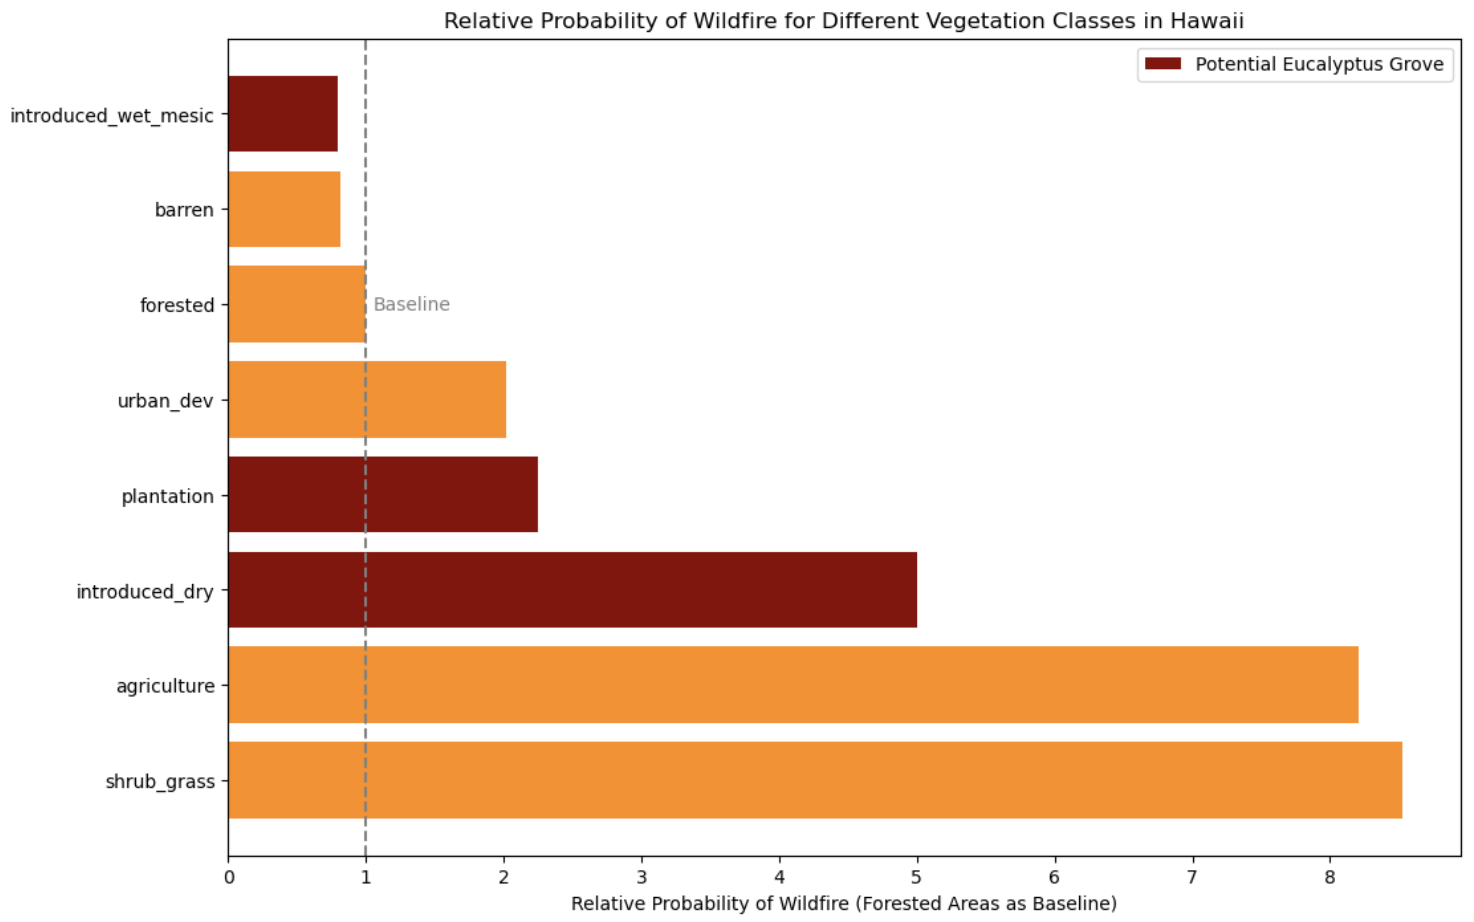 Shrubs, grass, and agriculture are all substantially more likely to have wildfires than eucalyptus grove-type vegetation.
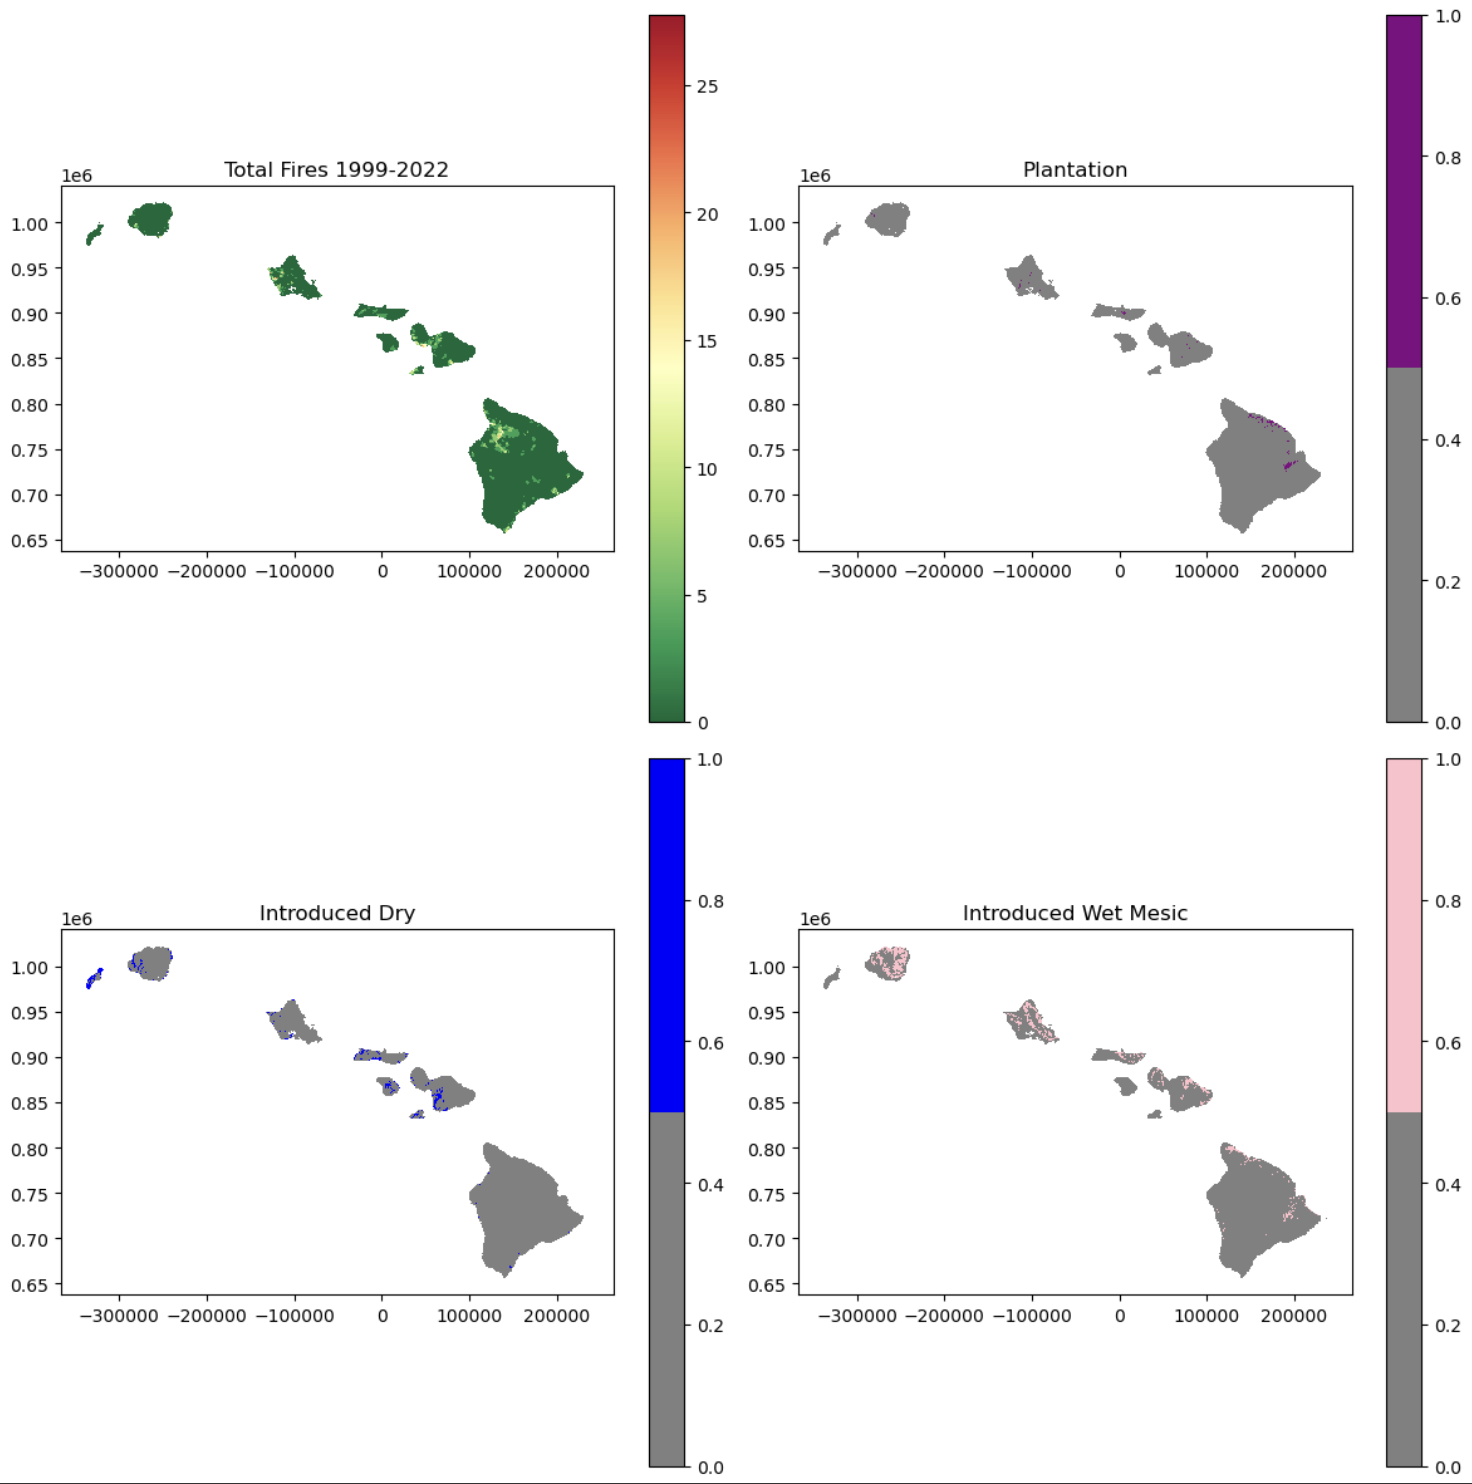 The lack of overlap between the potential eucalyptus groves (which I don’t have specific data on, so have to guess where they might be based on broader categories of vegetation) and wildfire hotspots is clear on the map.
I have some suspicions that the reporter has a specific story in mind he wants to tell, and is looking for data to support that story instead of the other way around. As he is interested in seeking a grant to further the work I did, I will need to remember to be cautious about how the work will be used. If I’m not convinced the true story in the data will be told, I’ll be comfortable no longer pursuing the work. I did find, however, that my fairly simple model explained quite a large portion of the spatial variance in wildfire occurrence. I think it would be fairly easy to add more temporal data on populations, tourism, and weather patterns (and use a more complex model) to have an explainable live wildfire risk map for the state. I’ll dedicate a weekend in August to finishing this, and share it with Clay Trauernicht, who seems to be the leading authority on the subject.
I’m also working on another Zindi project, as a bit of a summer treat. The goal is to estimate ground-level NO2 in Northern Italy, for the International Telecommunication Union (ITU). I’m planning to submit a prediction done with a 2D ConvLSTM, since I’m using those anyway for the Nile project and now have a quite a bit of experience working with them. I’m curious how such a model would perform in a ML contest.
 Location of NO2 sensors in Northern Italy. Since anthropogenic activity is a major contributor to ground-level NO2 levels, knowing proximity from urban centres will be crucial to getting good predictions.
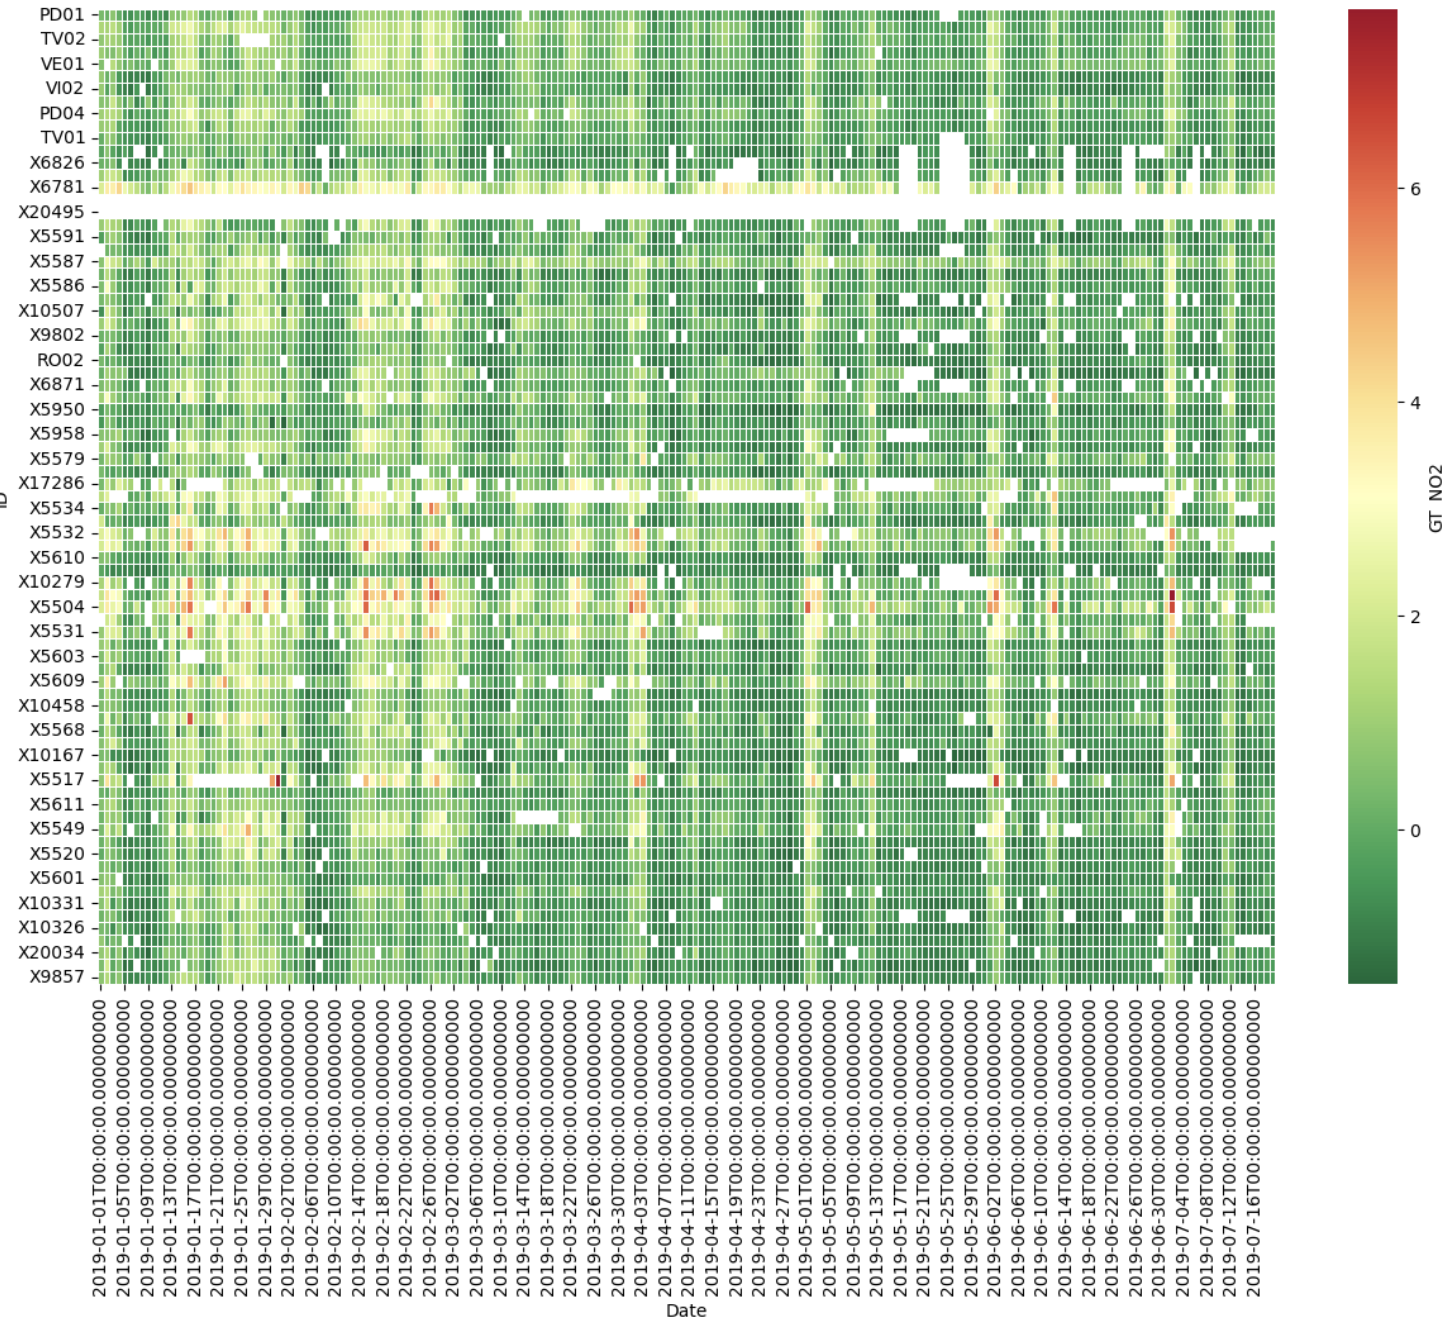 When ordering the sensors by location (distance from the PD01 sensor, as an example), it is clear that there are spatio-temporal relationships in NO2 levels.
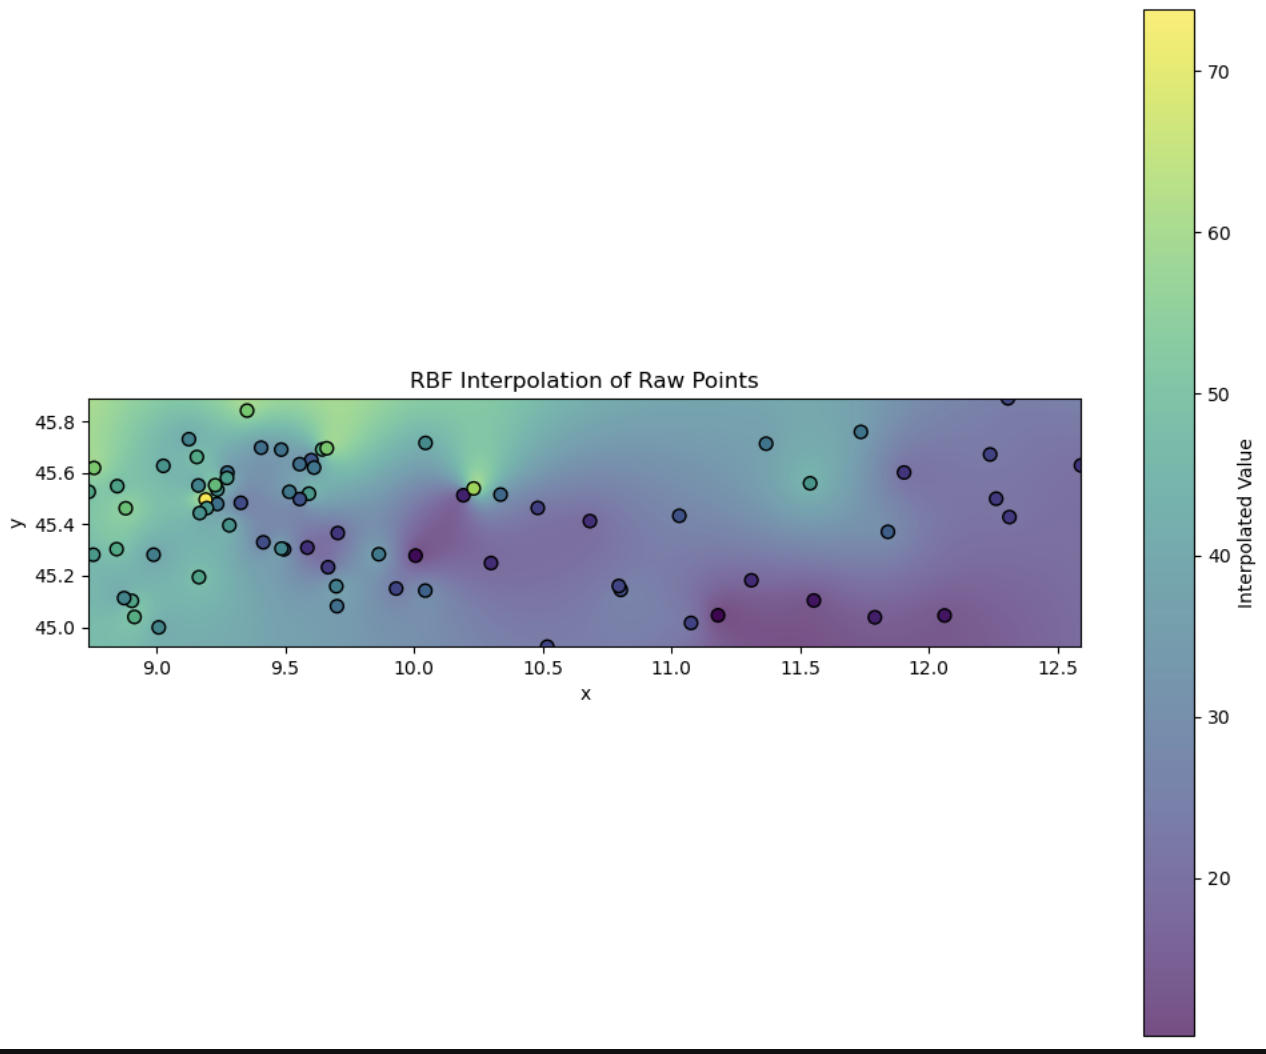 Since the sensors only provide point-wise data, I need to first convert their values to an interpolated raster grid, which I’ve done here using a radial basis function with a linear kernel. This will be the input to the network.
These projects (and their excessive technical details) have consumed a large chunk of my time. I believe this is time well-spent, as I am building quite a substantial portfolio of impactful projects. The Nile project in particular I am most optimistic about, as everyone involved is very keen to use the results in a tangible manner to improve decision-making.
Enhancing Agricultural Yields with Explainable AI
Another project with progress, but not results, that I believe I might be neglecting due to splitting my focus in too many ways. As mentioned in my last post, my XYieldBoost crop yield model built for Digital Green was well-received, and we are now working on publishing.
This month I wrote most of the skeleton of an article to be submitted to Artificial Intelligence in Agriculture, but I’ve had to set it aside to deal with some of the technical issues that cropped up in the Nile project, which is more time sensitive. Fortunately, I also have two students working with Digital Green to build an updated model for 2024 that uses two years of data instead of the one used in our original model (all they could provide at the time) and working to avoid some of the overfitting issues guaranteed to be present in the original model. This, in my opinion, will be more impactful than any academic paper.
Etc.
Outside of learning and work, a few small pleasures: I found a beautiful Edwardian chair on a street near my house (perks of living in a Victorian neighbourhood!). The wood frame was pretty damaged, but we managed to glue it back in place.
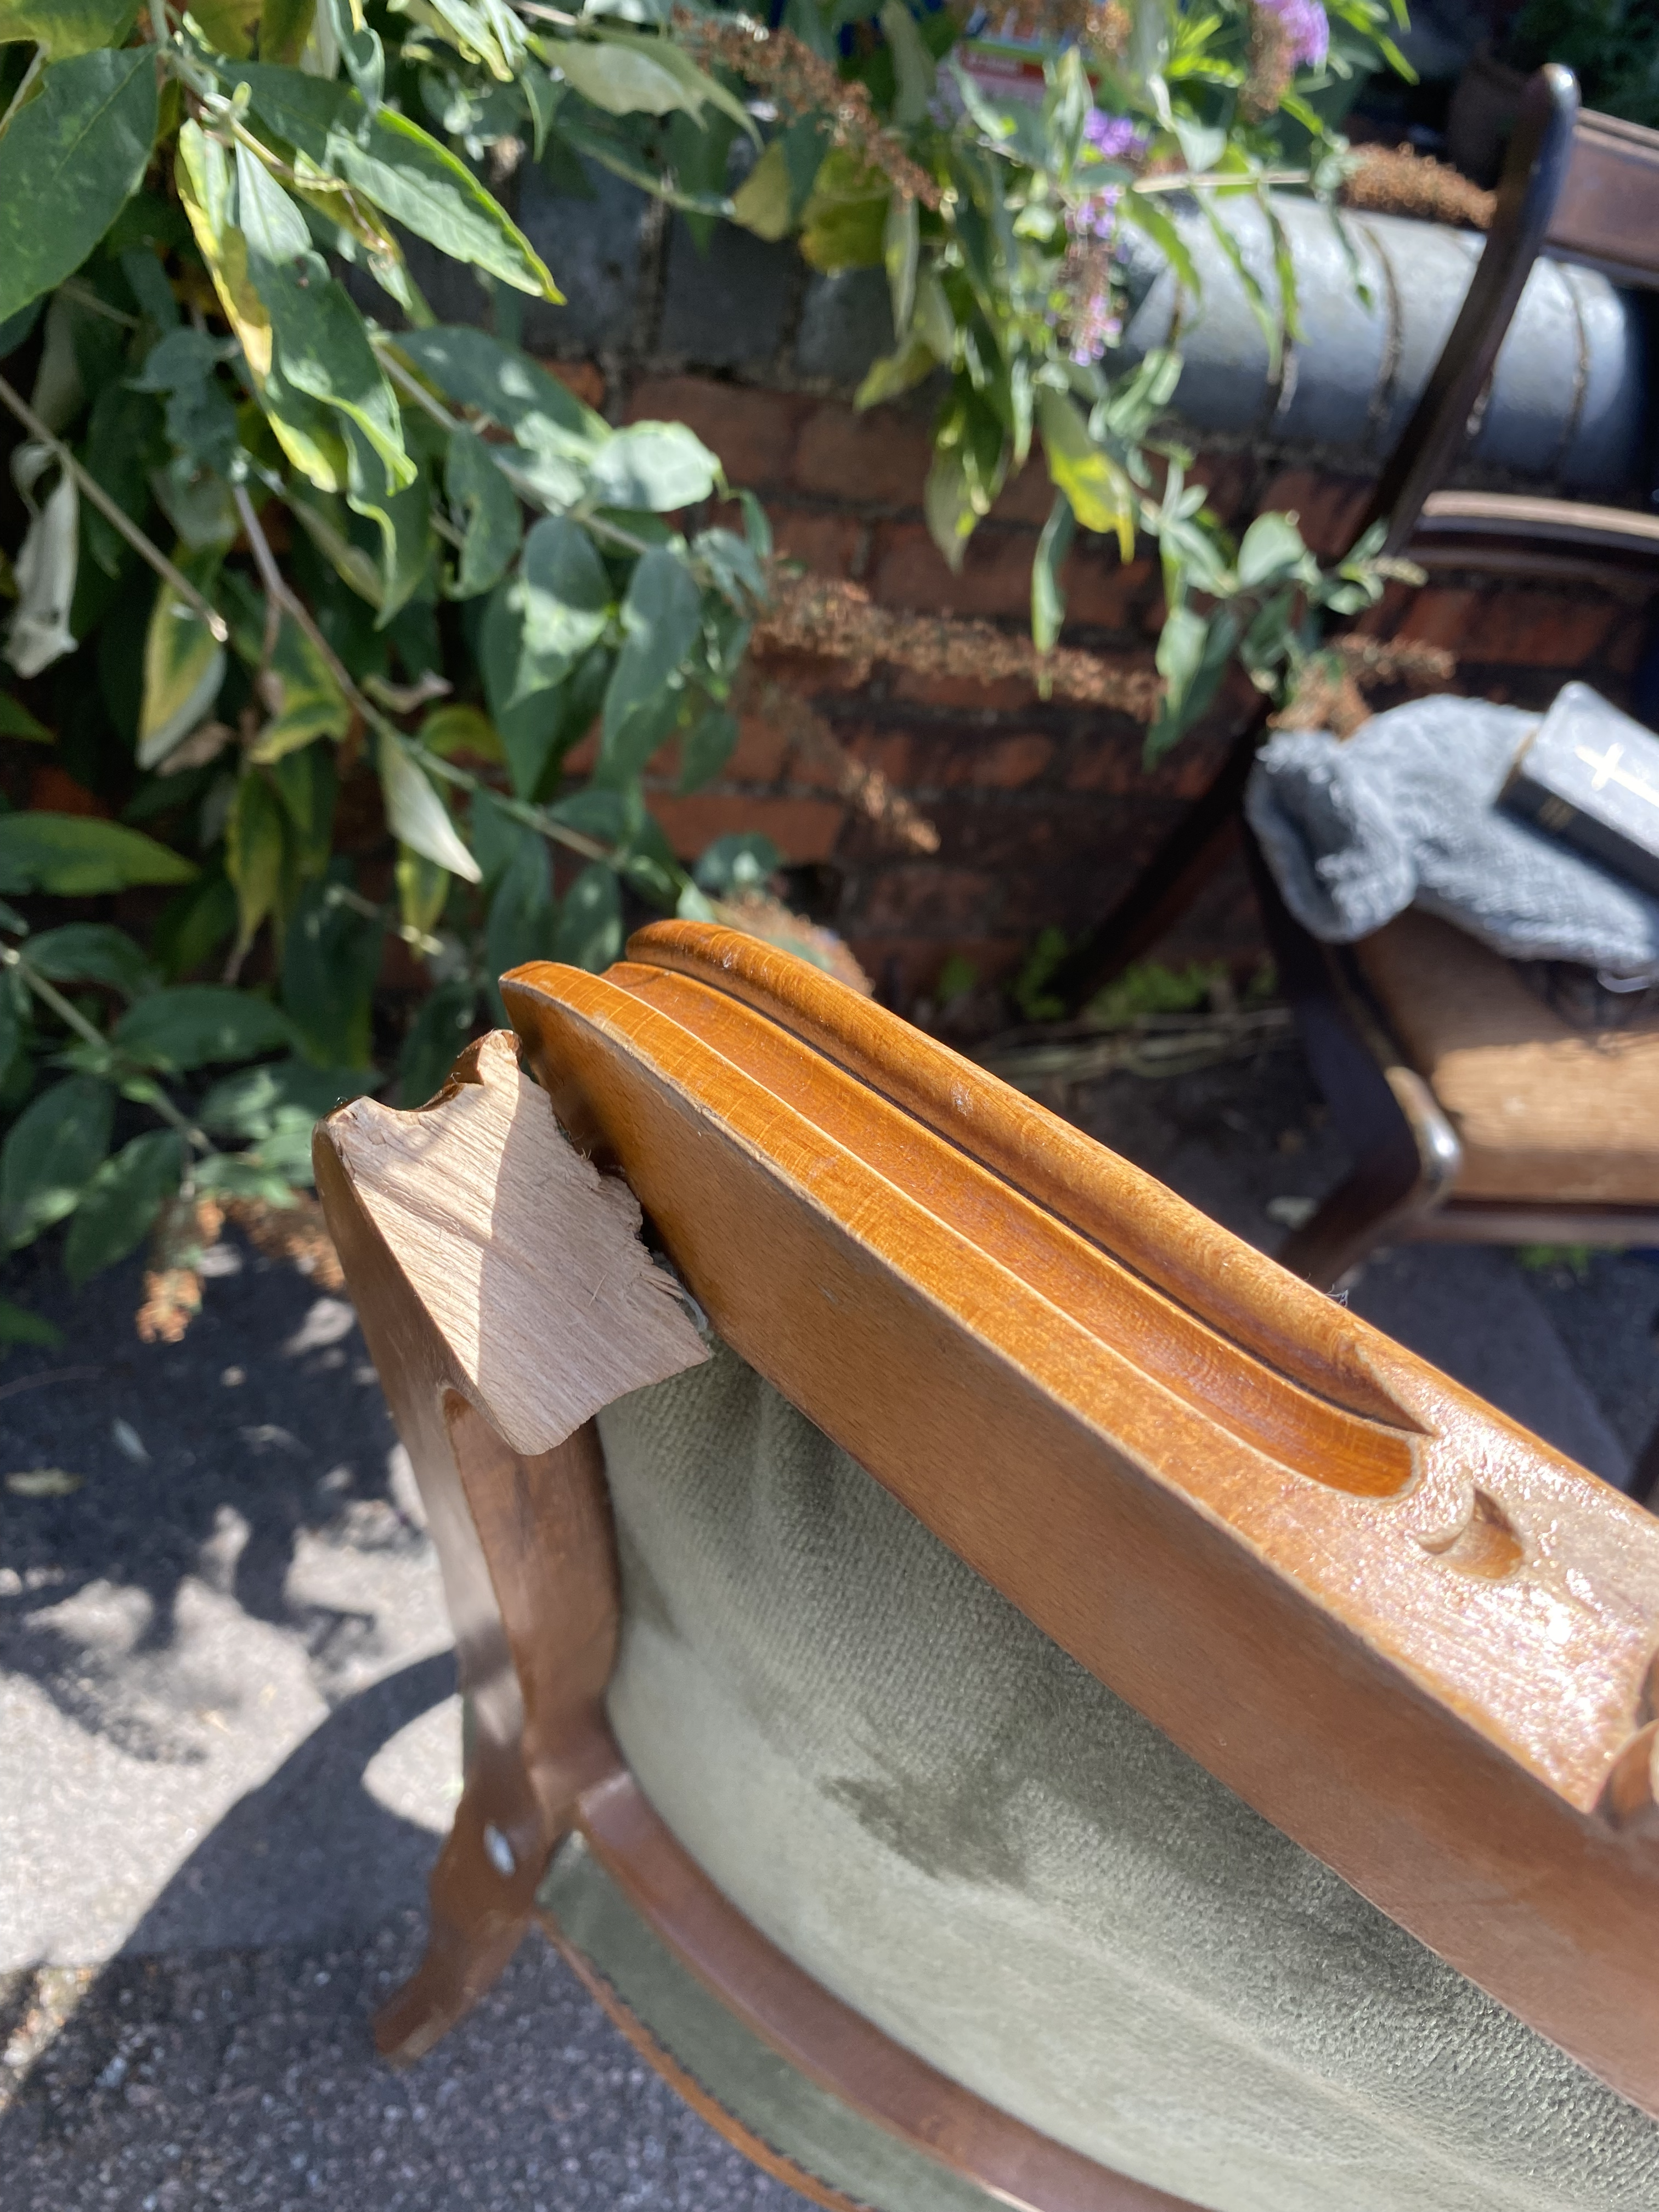 Initial damage, I was initially worried it wouldn’t be able to be fixed.
 Finished product! Still needs a bit of work to fix the beading around the edge, but overall I’m quite happy with the result.
This summer is already seeming to slip by, even though I am setting ambitious productivity goals. However, I am confident that I am making (at least) incremental progress.
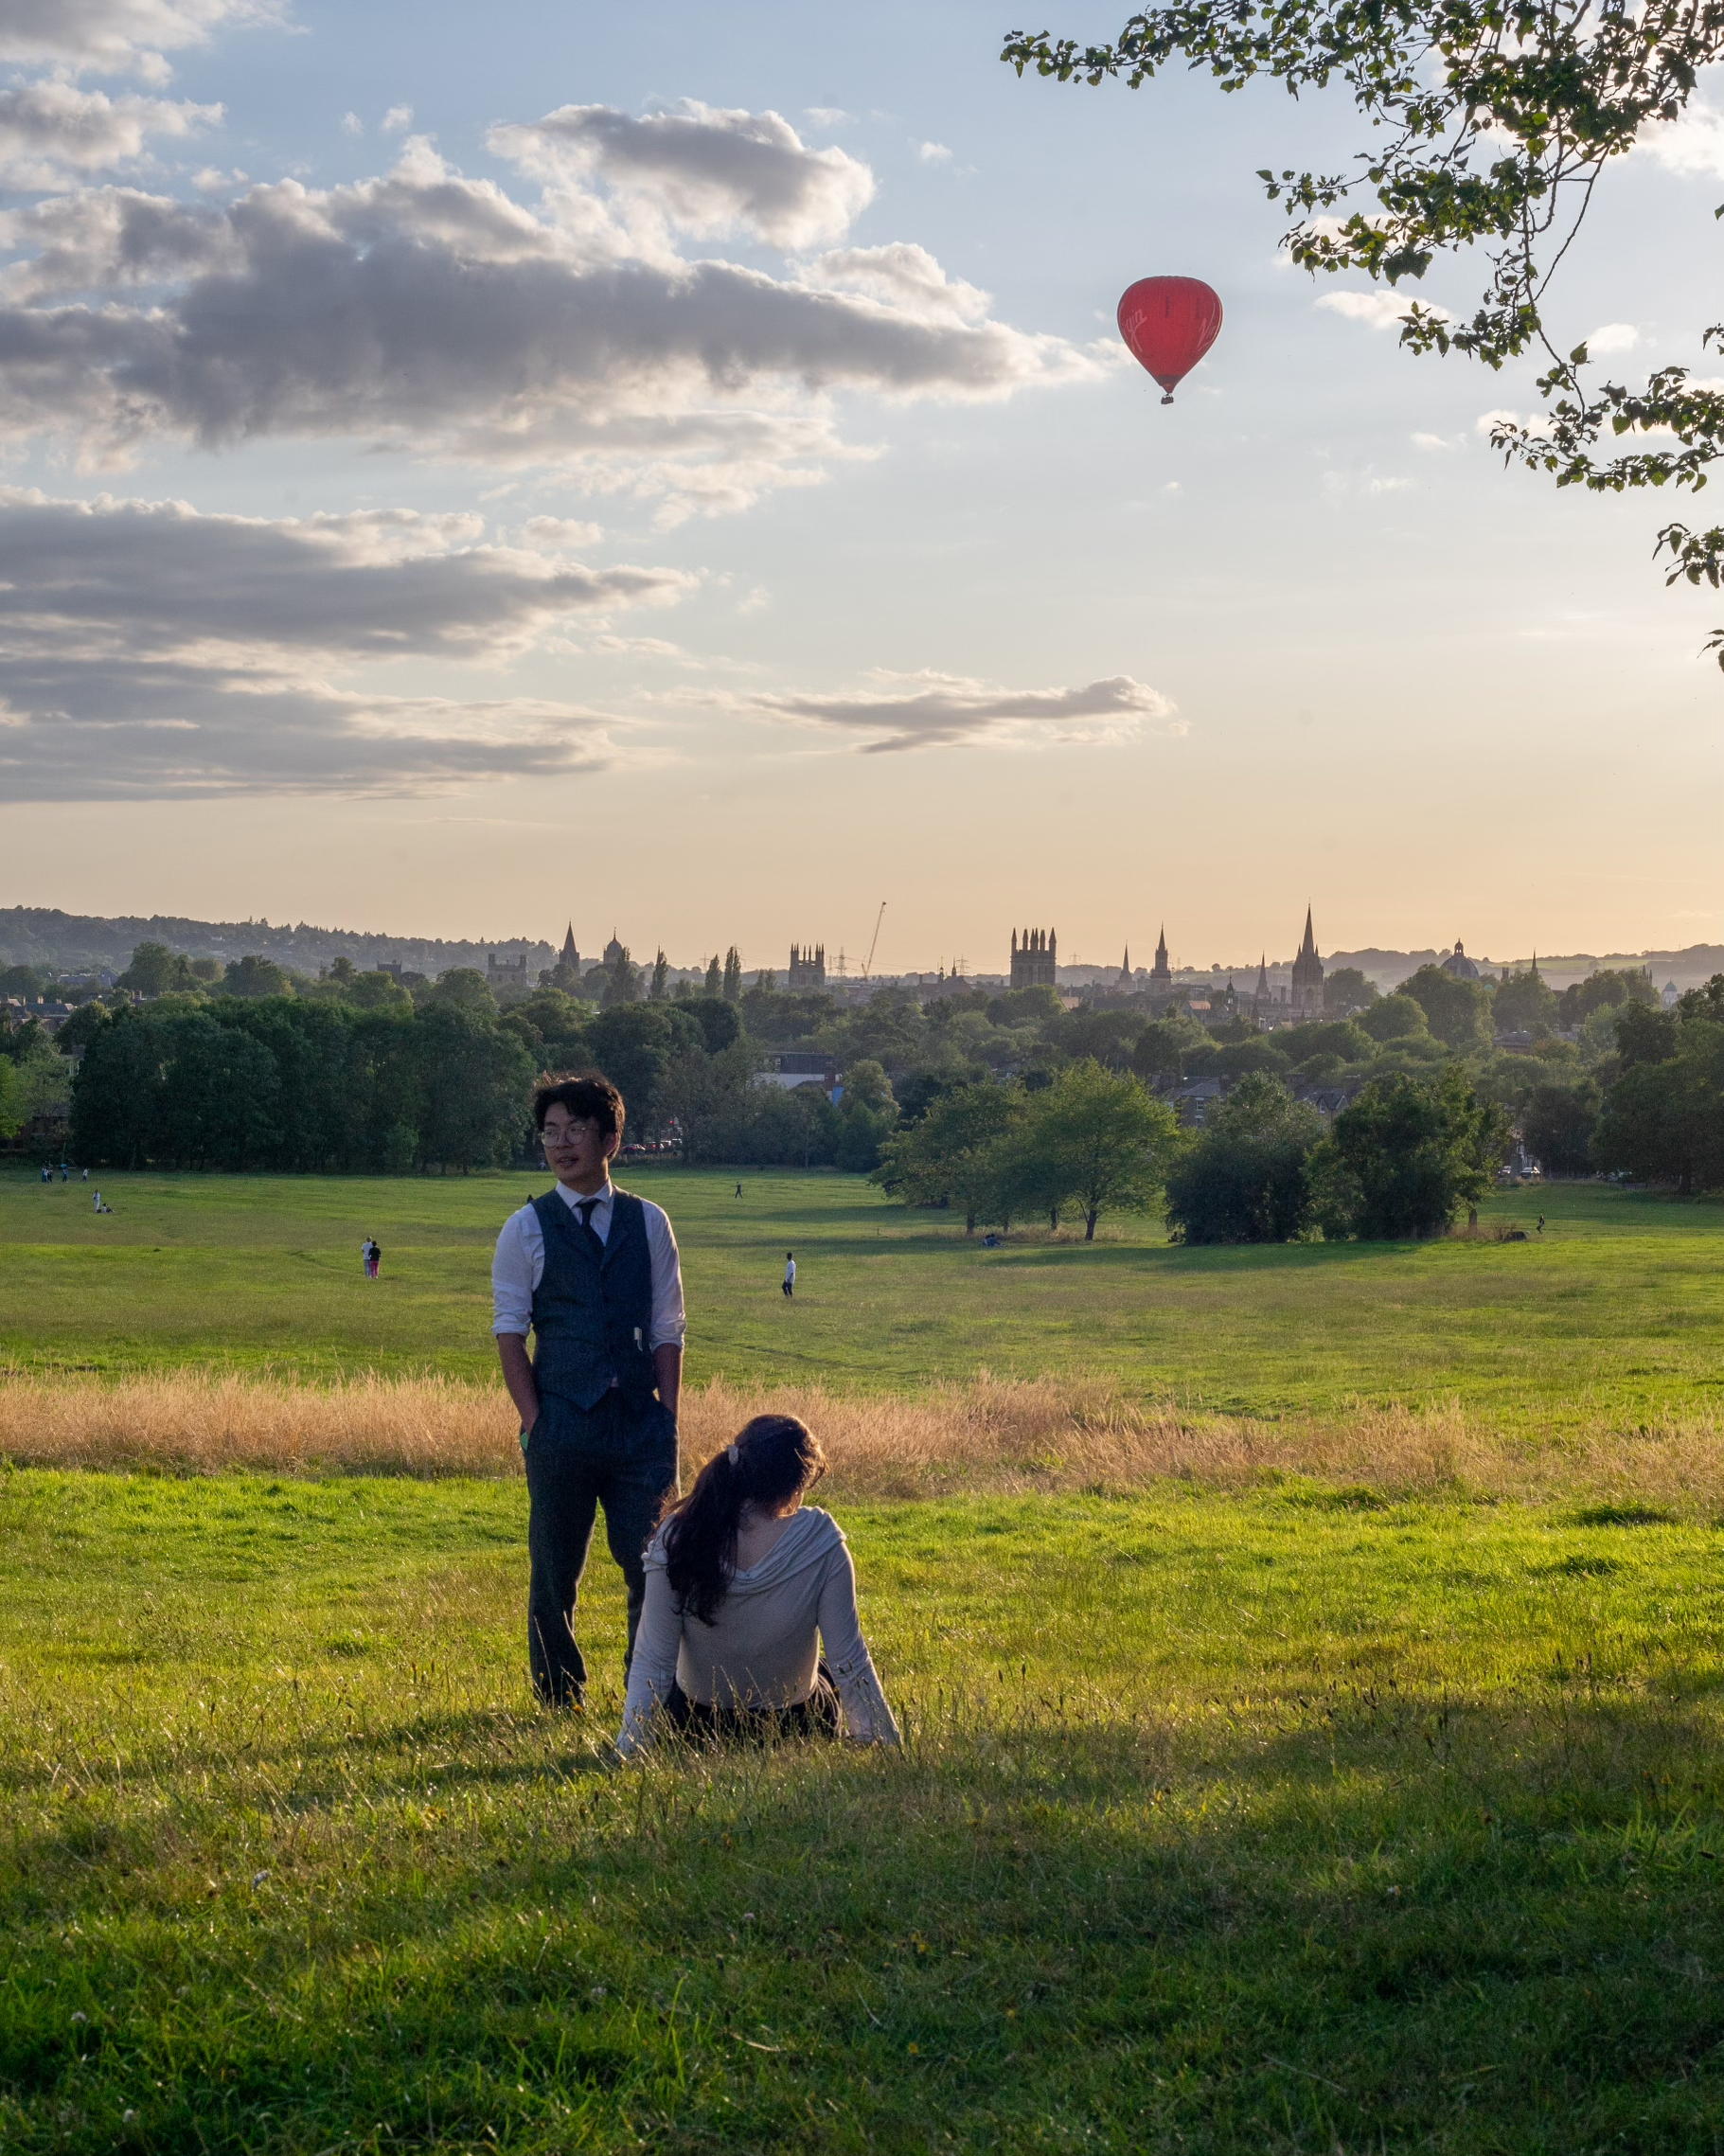 Beautiful end to the month.