In collaboration with Digital Green, I led a team to build a machine learning solution that predicts the crop yield per acre of rice or wheat crops in Bihar. The goal is to empower smallholder farmers and break the cycle of poverty and malnutrition in northern India.
Project Overview
| Motivation | Unpredictable monsoons cause high variability in crop yields, making it very difficult for Bihari farmers to produce consistent income from harvests |
| Model | An ensemble predictive machine learning model that predicts and explains seasonal crop yield |
| Client | Digital Green |
| Status | Complete |
| Outcome | Shared results with Digital Green |
Smallholder farmers are crucial contributors to global food production, and in India often suffer most from poverty and malnutrition. These farmers face challenges such as limited access to modern agriculture, unpredictable weather, and resource constraints. To tackle this issue, Digital Green collected data via surveys, offering insights into farming practices, environmental conditions, and crop yields.
A crop yield model could revolutionise Indian agriculture, and serve as a global model for smallholder farmers. Accurate yield predictions empower smallholder farmers to make informed planting and resource allocation decisions, reducing poverty and malnutrition and improving food security. As climate change intensifies, adaptive farming practices become crucial, making precise yield predictions even more valuable. Solutions developed here can drive sustainable agriculture and ensure a stable food supply for the world’s growing population.
We used an ensemble method that took the average of three predictions made using tree-based methods, specifically: XGBoost, CatBoost, and LightGBM. All three of these are tree-based methods, which are great for handling tabular data with non-linear relationships. We also used cross-validation to train and test our model in order to reduce overfitting.

However, I think the most important part was the data cleaning stage. We probably spent 95% of the time on data cleaning, which involved working to understand the variables and reading literature on which variables affect crop yield in Bihar/India. As a result, we learned about different agircultural traditions in North Bihar vs. South Bihar (which is more agriculturally productive and employs the Ahar Pyne agricultural system, leveraging channels and retention ponds to manage water resources and adapt to Bihar’s unpredictable weather). We also learned about the importance of the monsoon in Bihar agricultural cycles. Kharif crops, such as rice, are sown during the monsoon season from June to September and are watered by monsoon rainfall. These crops do well with high rain in Winter. Rabi crops, such as wheat, are sown in mid-November – preferably after the monsoon rains are over – and are watered by percolated rainfall. These crops are spoiled by high rain in winter. We also learned about nitrogen cycles, fertilizer application methods, and irrigation techniques.
With all of this information, we had a pretty good idea that the region in which the crops was grown was important (North vs. South Bihar), as were the various dates on which key agricultural steps were taken, as were the fertilisation choices. We engineered our data to reflect this, and selected the top variables using recursive feature elimination with cross validation.
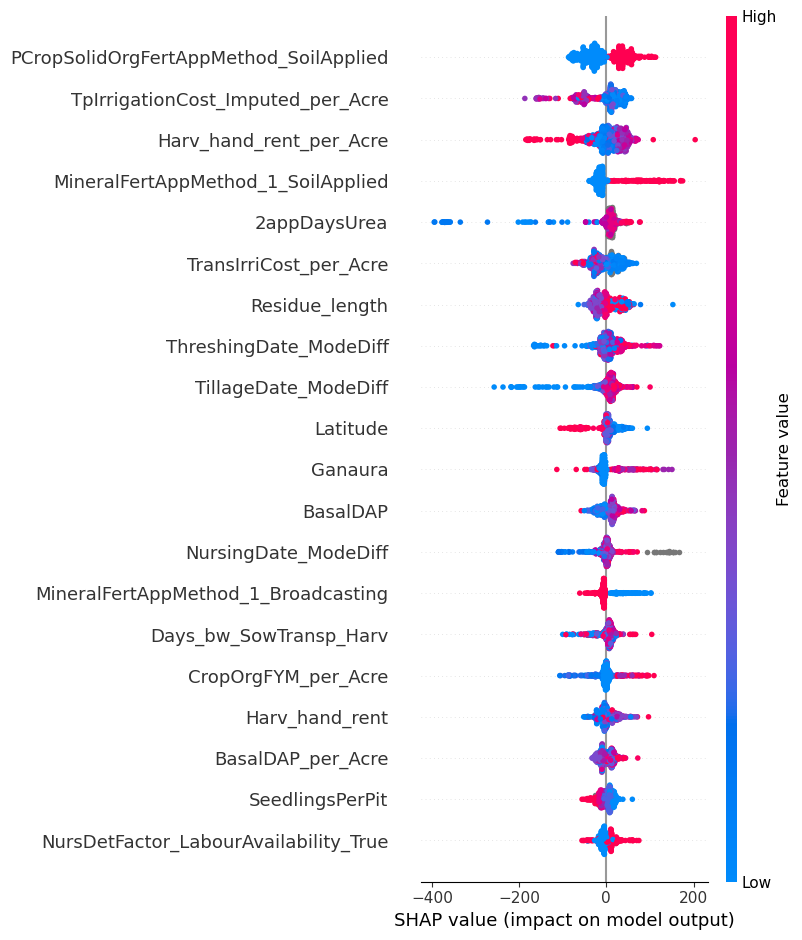
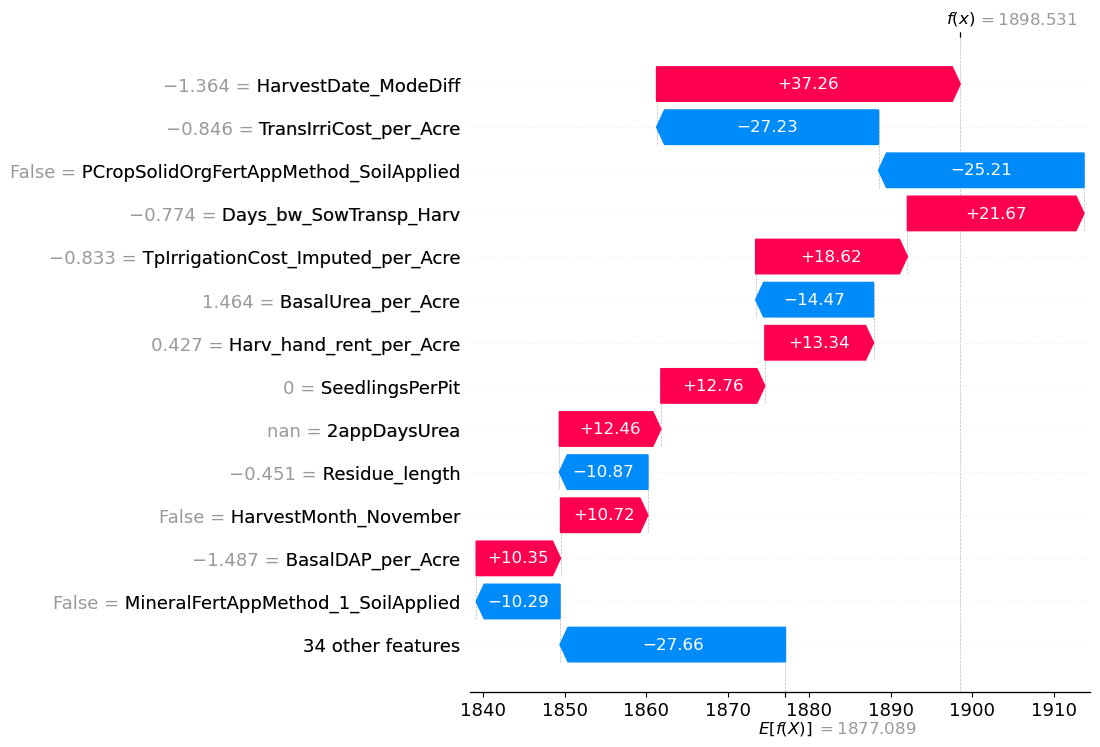
We also took additional steps to ensure that the end user of the data (Digital Green) will be able to make as much use as possible from our results. To provide them with additional insights, we calculated Shapley values for each variable, which are the average expected marginal contribution of one variable after all possible combinations have been considered. These can be seen similarly to the variable importance indicators that can be extracted from random forest models.

Digital Green may be able to leverage the information provided by the Shapley values to improve crop yield for Bihar farmers. For example, as seen in the above plot, applying organic fertiliser directly to the soil in the previous crop cycle was very consistently associated with higher yield per acre. It might then be worthwhile for Digital Green to spread this information to farmers, or possibly even invest in directly giving them fertilisation tools that enable direct soil application.

All the code and data for this analysis can be found here.
