Surprising large amount of progress on projects, with thoughts towards their future impact.
Wrapping Up INFLOW
Though I’ll likely be on call to do things now and again for the near future (and am very keen to do so, as this has been one of the most impactful projects I’ve worked on so far), my work on the INFLOW project is just about coming to an end. This month I put the final touches on the spatial model, and sent it out into the world (at least onto JASMIN. I also ventured back to Reading to present what I’ve managed to accomplish to one of the project funders.
Our collaborators at Médecins Sans Frontières (MSF) have been very keen to get this model, as it actually has the potential to impact decision-making at a highly granular level (whereas the temporal component of the model is more useful for high-level funding decisions and advocacy). A pretty good example of how difficult it is to connect analysis with impact. They have been working directly with me on the visualisations that the model automatically produces every (roughly) ten days to find something that will have the most use to people on the ground.
 Currently I’m trying to show all three forecast scenarios on a single map (worst case is top 95th percentile of the temporal prediction which thresholds the number of pixels on the spatial model that are filled, best case is bottom 95th percentile, and likely case is the median temporal prediction – all based on Monte Carlo dropout for the transformer temporal model).
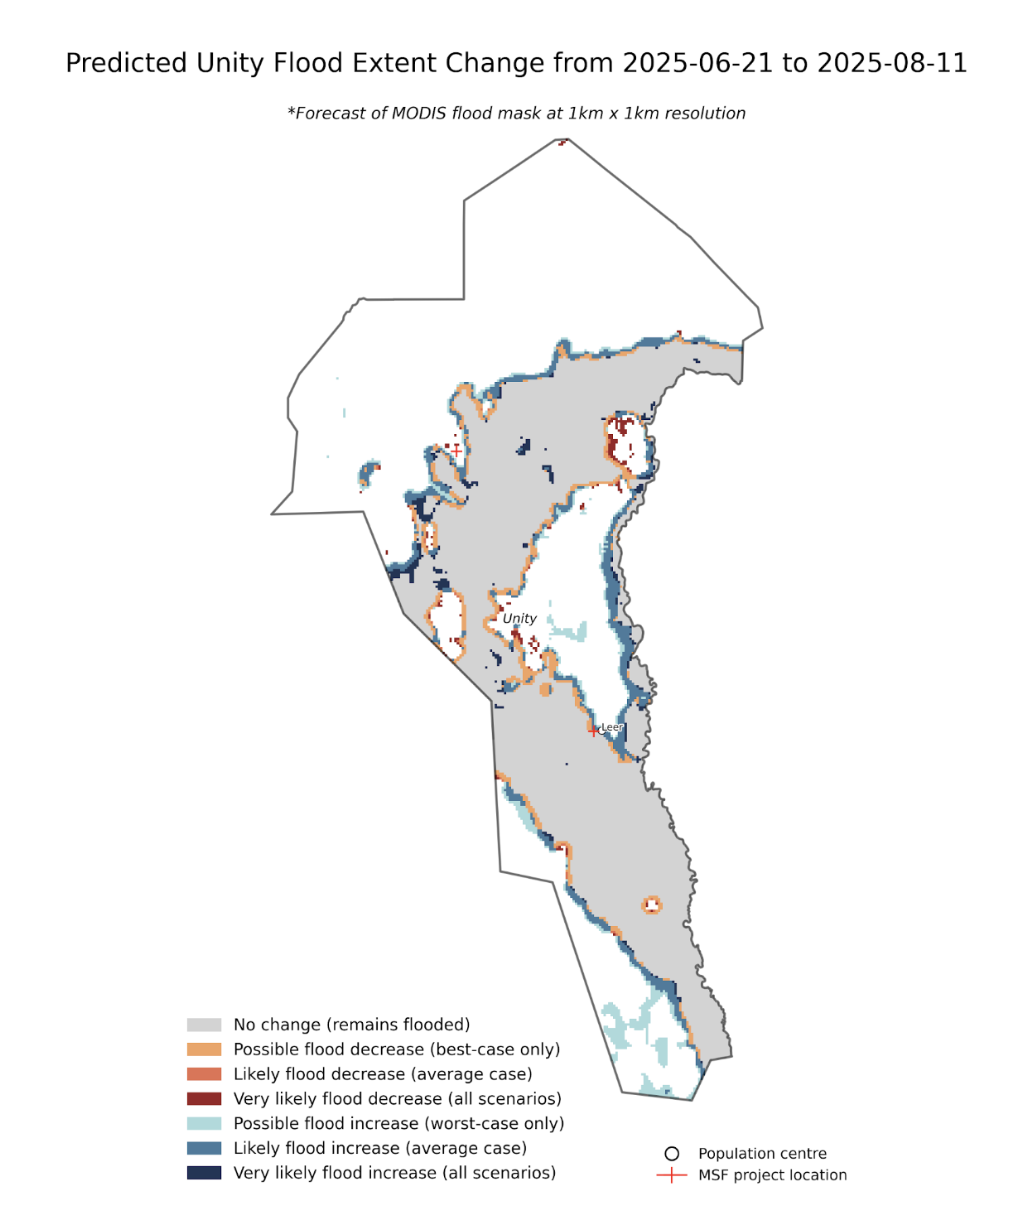 A zoom in on Unity state and the MSF projects located there.
The model is a ConvLSTM trained on spatio-temporal data (first principal component of highly correlated HydroBASINS data, elevation, inundation patterns, rainfall, and soil moisture) for the region subsetted into overlapping patches. The total pixels that are flooded is determined by the temporal transformer model which I have previously described (it predicts the percent of area for the total country that will be flooded, the spatial model stitches together the predicted binary probabilities for each spatial patch and fills in order of descending probability until that percent is reached). I also have a paper in the works with all the methodology and evaluation metrics, which I will be able to share soon! Though getting the academics involved to proof read is taking some time…
The model thoroughly beats all the available baselines, hopefully justifying it’s cost in terms of my grant and time.
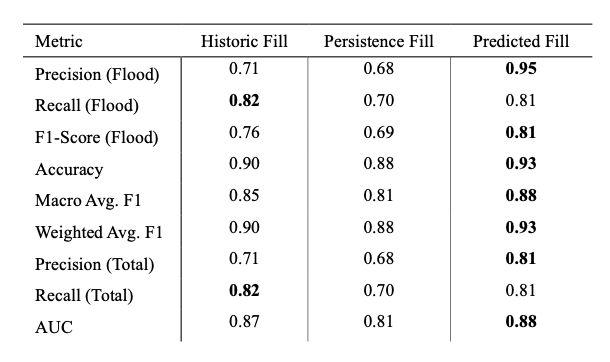
Classification metrics for the INFLOW-AI local spatial interpolation models and the ConvLSTM model predictions. The best score for each metric is bolded.
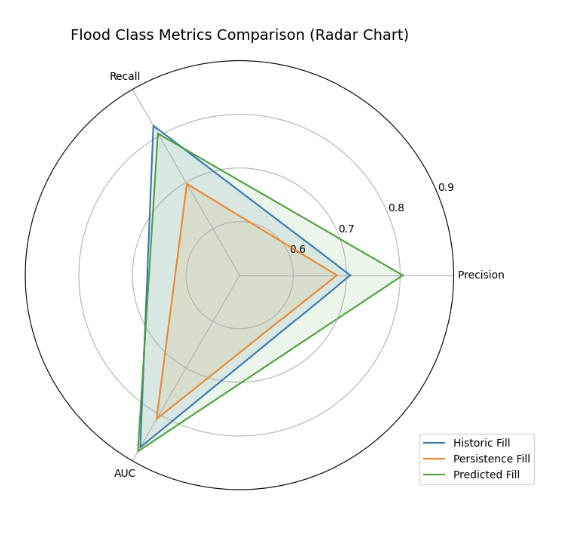
Comparison of key classification metrics for the ConvLSTM model (predicted fill) with the historic average and the persistence model. (Technically same thing as the above chart with less information, but aren’t radar charts fun?).
What’s Next
It’s amazing how fast I can move on other projects now that the main focus on INFLOW has passed. I now have about six projects concurrently running through the Algorithmic Governance Foundation. I’ve got an office, I’m managing 13 volunteers (and growing!). Things are good.
I’m working with 510 (the Netherlands Red Cross data team). They are an excellent group that essentially builds models and does analysis for all IFRC activities to support National Societies around the world. I’ve done work for them in the past, but my current project aligns quite well with something that I’ve always wanted to do: build a portal to analyse risk for natural disasters. 510 wants support with their “eVCAs”, which are enhanced Vulnerability and Capability Assessments – essentially just mapping assets/exposure and hazards on the same map. Well, now I get a chance to help automate that process and hopefully make it a lot better (e.g. doing actual analysis to provide concrete information to decision-makers instead of static map that raises more questions than answers). It is interesting that to make data into useful information, you have to essentially collapse the dimensionality information into a single sentence or number.
With regards to the kinds of answers the tool will be able to provide: there is substantive analysis paralysis on this front, as the disconnect between analysts (who have the data but don’t know what analysis the decision-makers need) and decision-makers (who know what analysis they need but not how to get it) is massive.
Since all the data I’m working with is fairly standard (in terms of exposure and hazard layers), I’m thinking that writing a paper with some of my 510 colleagues might be warranted to help provide a clearer path for how this kind of data can be translated into actionable decisions. As far as I can tell, there is not a great amount of information available on this topic.
Some examples of analytical questions I intent to answer for the flood hazard maps:
A. National-Level Prioritisation
- Disaster Risk Management Planning
- Which districts or regions have the highest number of settlements exposed to frequent flooding (10–50 year return periods)?
- Which provinces have the greatest concentration of health or education infrastructure within 100-year flood zones?
- Where is high population exposure (dense settlements) overlapping with high-frequency flood zones (10–25 year)?
- Which provinces have road networks with the highest percentage of exposure to 25–100 year floods?
- Are informal settlements or high-vulnerability zones disproportionately exposed to severe (100–500 year) events? Which administrative zones should be prioritised for disaster risk reduction investments based on combined hazard and exposure?
- Reference During Emergency Response
- Which areas are most likely to be affected in a 10–25 year flood event based on population and building exposure?
- Which national roads or bridge segments might be disrupted and should be flagged for pre-event route planning?
- Which hospitals or health centres are at high flood risk and may need emergency reinforcement or mobile alternatives?
- Where should emergency supply hubs or warehouses not be located due to recurring flood risk?
- Advocacy With Stakeholders
- Which high-exposure areas are not currently addressed by national adaptation or infrastructure plans?
- How does flood exposure intersect with poverty, displacement, or future development areas?
- Where are examples of avoidable risk — such as exposed school sites — that illustrate planning failures?
- How do different flood return periods (10, 100, 500 years) affect the scale of exposure nationally?
B. Local-Level Decision Making
- Disaster Risk Management Planning
- Which settlements or neighbourhoods are located within 10–100 year flood zones?
- Which roads provide the only access to communities and are exposed to flooding?
- What are safe locations for evacuation centres or aid distribution points based on non-exposure to flooding?
- Which buildings in a community are both exposed and structurally vulnerable (e.g., informal housing)?
- Where could community-level mitigation be most effective (e.g., raised walkways, protective barriers)?
- Reference During Emergency Response
- Where are critical facilities like clinics or shelters in relation to high-frequency flood zones?
- Which communities are likely to be isolated and require pre-positioned aid?
- What alternate access routes are available if main roads are flooded?
- Which communities have both high flood risk and high population density, requiring priority assistance?
- Advocacy With Stakeholders
- Are public buildings still operating in flood-prone areas despite available risk data?
- Is there evidence of inequitable exposure — such as low-income areas more frequently located in flood zones?
- Can local examples (e.g., repeatedly flooded schools) be used to advocate for funding or protective investments?
- How can flood exposure data support community lobbying for infrastructure improvements or land-use changes?
For now, the app is live on HuggingFace (did you know you can deploy apps there and use 16GB RAM for free?) I won’t link the tool as it’s meant to be an internal Red Cross tool, but I’ve included a picture below.
 Currently all that’s done is providing a single point for analysis to download all the available hazard and exposure information for a given region. Small steps, but already very useful for the 510 team.
I’ve also acquired a project to deploy the AGF’s LLM-web scraping model LexiMine to assist in a real biosecurity project – namely tracking vaccine approval policies in ASEAN countries. More on that to follow next month.
Doing Something Useful Maybe
As I’ve posted before, the current invasion of the Gaza Strip is one of the most deadly ones for civilians in recent history. As a consequence, I’ve been doing some work to use whatever skills I have to assist in efforts to reduce civilian casualties. The possible theory of change for having any impact in this area is extremely tenuous, as unlike other projects I am working on there is not even universal political agreement that efforts to reduce civilian casualties are needed. Further, Israel’s complete control over all access to the Strip means that no aid can enter without the COGAT approval, severely limiting the utility of, say, a tool that helps optimise aid distribution. Unfortunately, the only thing that can be done in this case is targeted advocacy, especially on higher echelons of international relations such as the ICJ (ineffective though it may be).
As mentioned in my last update, I am working with Forensic Architecture to develop a machine learning model to more quickly and accurately map individual tents for displaced persons in the Gaza Strip. The end goal of this is not to better distribute aid, but to provide undeniable evidence of the extreme impact of this invasion on civilians. This does nothing to help people now, but is something that can be used in the future to possibly achieve justice and pressure to prevent further atrocities.
I’ve often heard critics of the public’s focus on Gaza complain that people don’t care about similar crises in Sudan. My response to that would be that if someone brings up war crimes and man-made famine induced by the SAF, no one will crawl out of the woodwork to deny, deflect, or justify. I would love the crisis in Gaza to receive the same kind of apathy that the one in Sudan receives. Universal agreement that ethnic cleansing is bad would be a major step forward from the current situation.
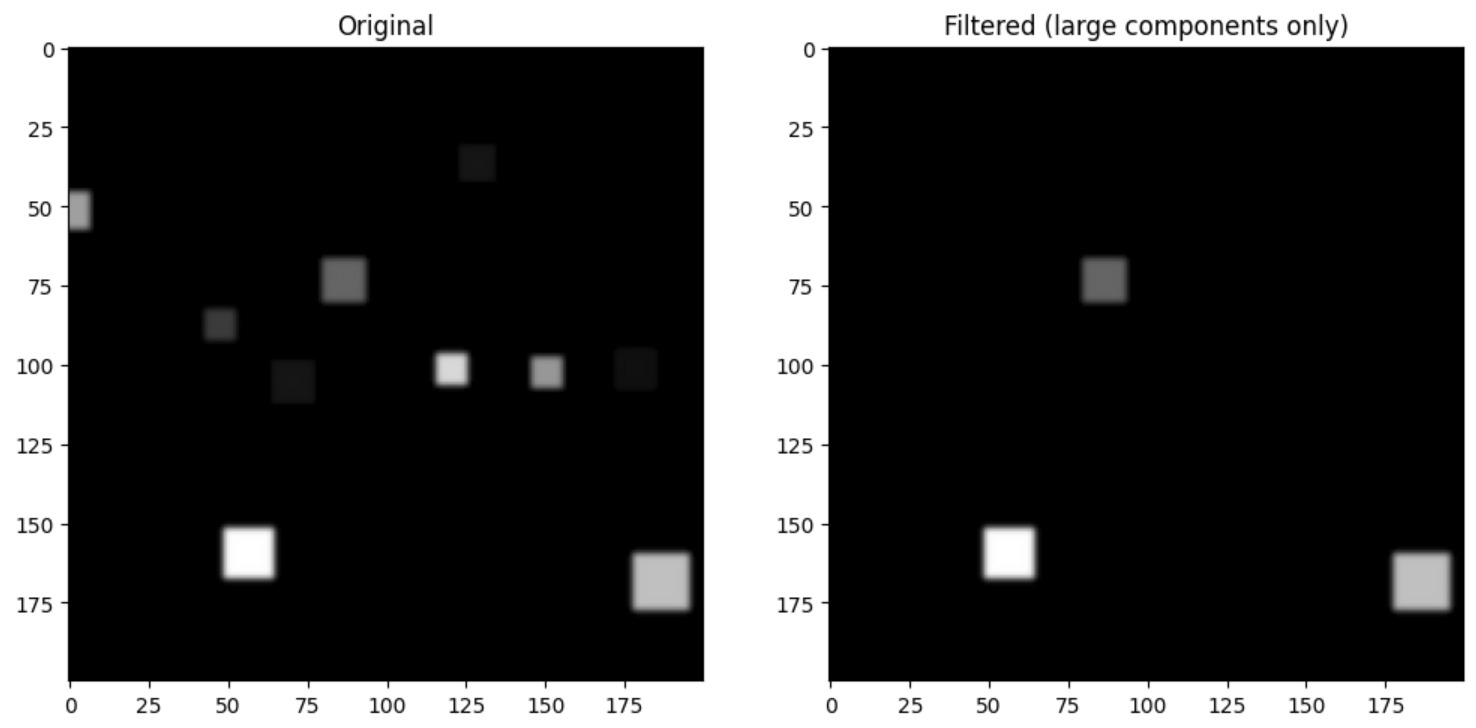
The tent model for Forensic Architecture, built by this guy, is now doing quite well, though it still isn’t generalising well to regions outside the training sample (not a huge issue, since we only need to predict for the Strip and don’t care about spatially out-of-sample data). The model now seems to be basically doing better than the original annotations that we used to train the model, which is insanely impressive.
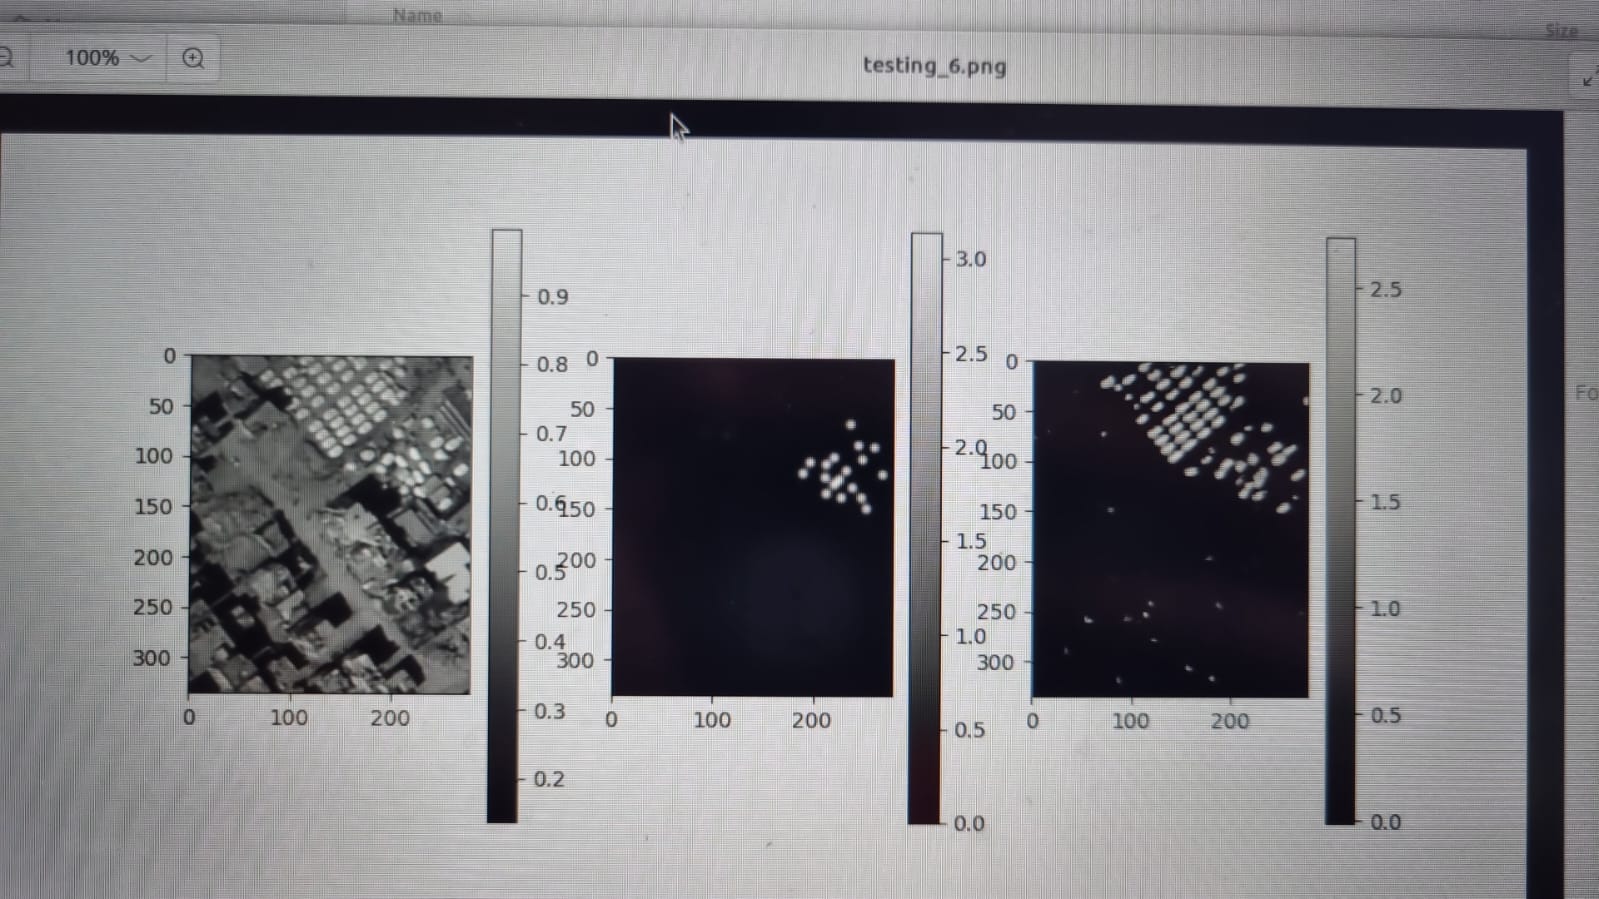 First panel is original satellite image, second is what the Forensic Architecture annotators identified as tents, third is what our model is identifying as tents (clearly much better than the annotation).
There’s a few pesky artefacts in there that can easily be removed through Gaussian filtering.
 Bye.
Bye.
I also ran an OSINT workshop at Trajan House with about 15 student volunteers to improve the manual annotations of tent locations on the internal Forensic Architecture platform. Just in case the machine learning model ultimately isn’t very good, or takes too long to develop, or just needs better quality training data.
Oh, and (unrelated to Forensic Architecture) I’ve also built a fully automated website to display uncensored, graphic videos directly from the Gaza Strip. The site is called uncensoredgaza.org, and I strongly recommend not visiting if you already are sympathetic to the situation in Gaza, as it is very NSFL. The goal is to provide the link to activists so they can link or domain spoof individuals who deny war crimes so they can see for themselves what they are denying. Another possible use case for activists is to display on a screen in a public location. I’ve written (in my opinion) quite clever code to automatically update the website every day with new graphic images.
Productivity
A quick note on productivity: I think having a proper office with useable meeting spaces has been game changing for my personal focus and enjoyment of my work. I’ve also been listening to music while working, time-blocking by day and hour (which I highly recommend), and tracking everything I need to do in a single TODO list with reminders and scheduled tasks (I also have custom Gantt charts for every project I’m working on…).
Given the number of things I’m now responsible for, I basically need all of Monday just to track and plan the rest of the week. This may have once sounded insane to me, but getting things done on time would be impossible without it. I think I have a fairly good system going, and I’m curious to see how it will evolve over time.
Saying Goodbye
It’s that time of year again and one of the biggest downsides to living in a place like Oxford: all the one-year Masters students (and some of the DPhil students) are finishing up and moving on and out of the city.
It can be very hard to build lasting friendships or even feel like going through the effort of making new friends when everyone is only here ephemerally. Oxford is a very transitory place; almost no one who comes here intends to be here permanently. Others seem to be able to thrive with a very large circle of casual acquaintances, but I prefer having a small-to-medium circle of dedicated friends. You can learn so much more about people and have more adventures this way. To me it seems very sad to have the same tell the same anecdotes and stories hundreds of times to new people instead of learning more about people you actually like and already know.
I also know that I’m quite bad at maintaining contact with people. I tend to return about 80% of the energy people give back, and for those that aren’t incredibly motivated to maintain connection this basically means all conversations will eventually peter out and we will end up seeing each other again only if very particular circumstances arise, if at all.
 Bye.
Bye.
I suppose though even back in Toronto, most of my old friend group from undergrad has moved on or is planning to move on sometime soon, so no place is immune to transition.
Just Hanging Out
A lot happing in my personal life as well. I have started scuba lessons (after trying it out for the first time this month), I went to a rave in London, and I’ve gotten much better at life drawing. Oh, I’m also now addicted to coffee.
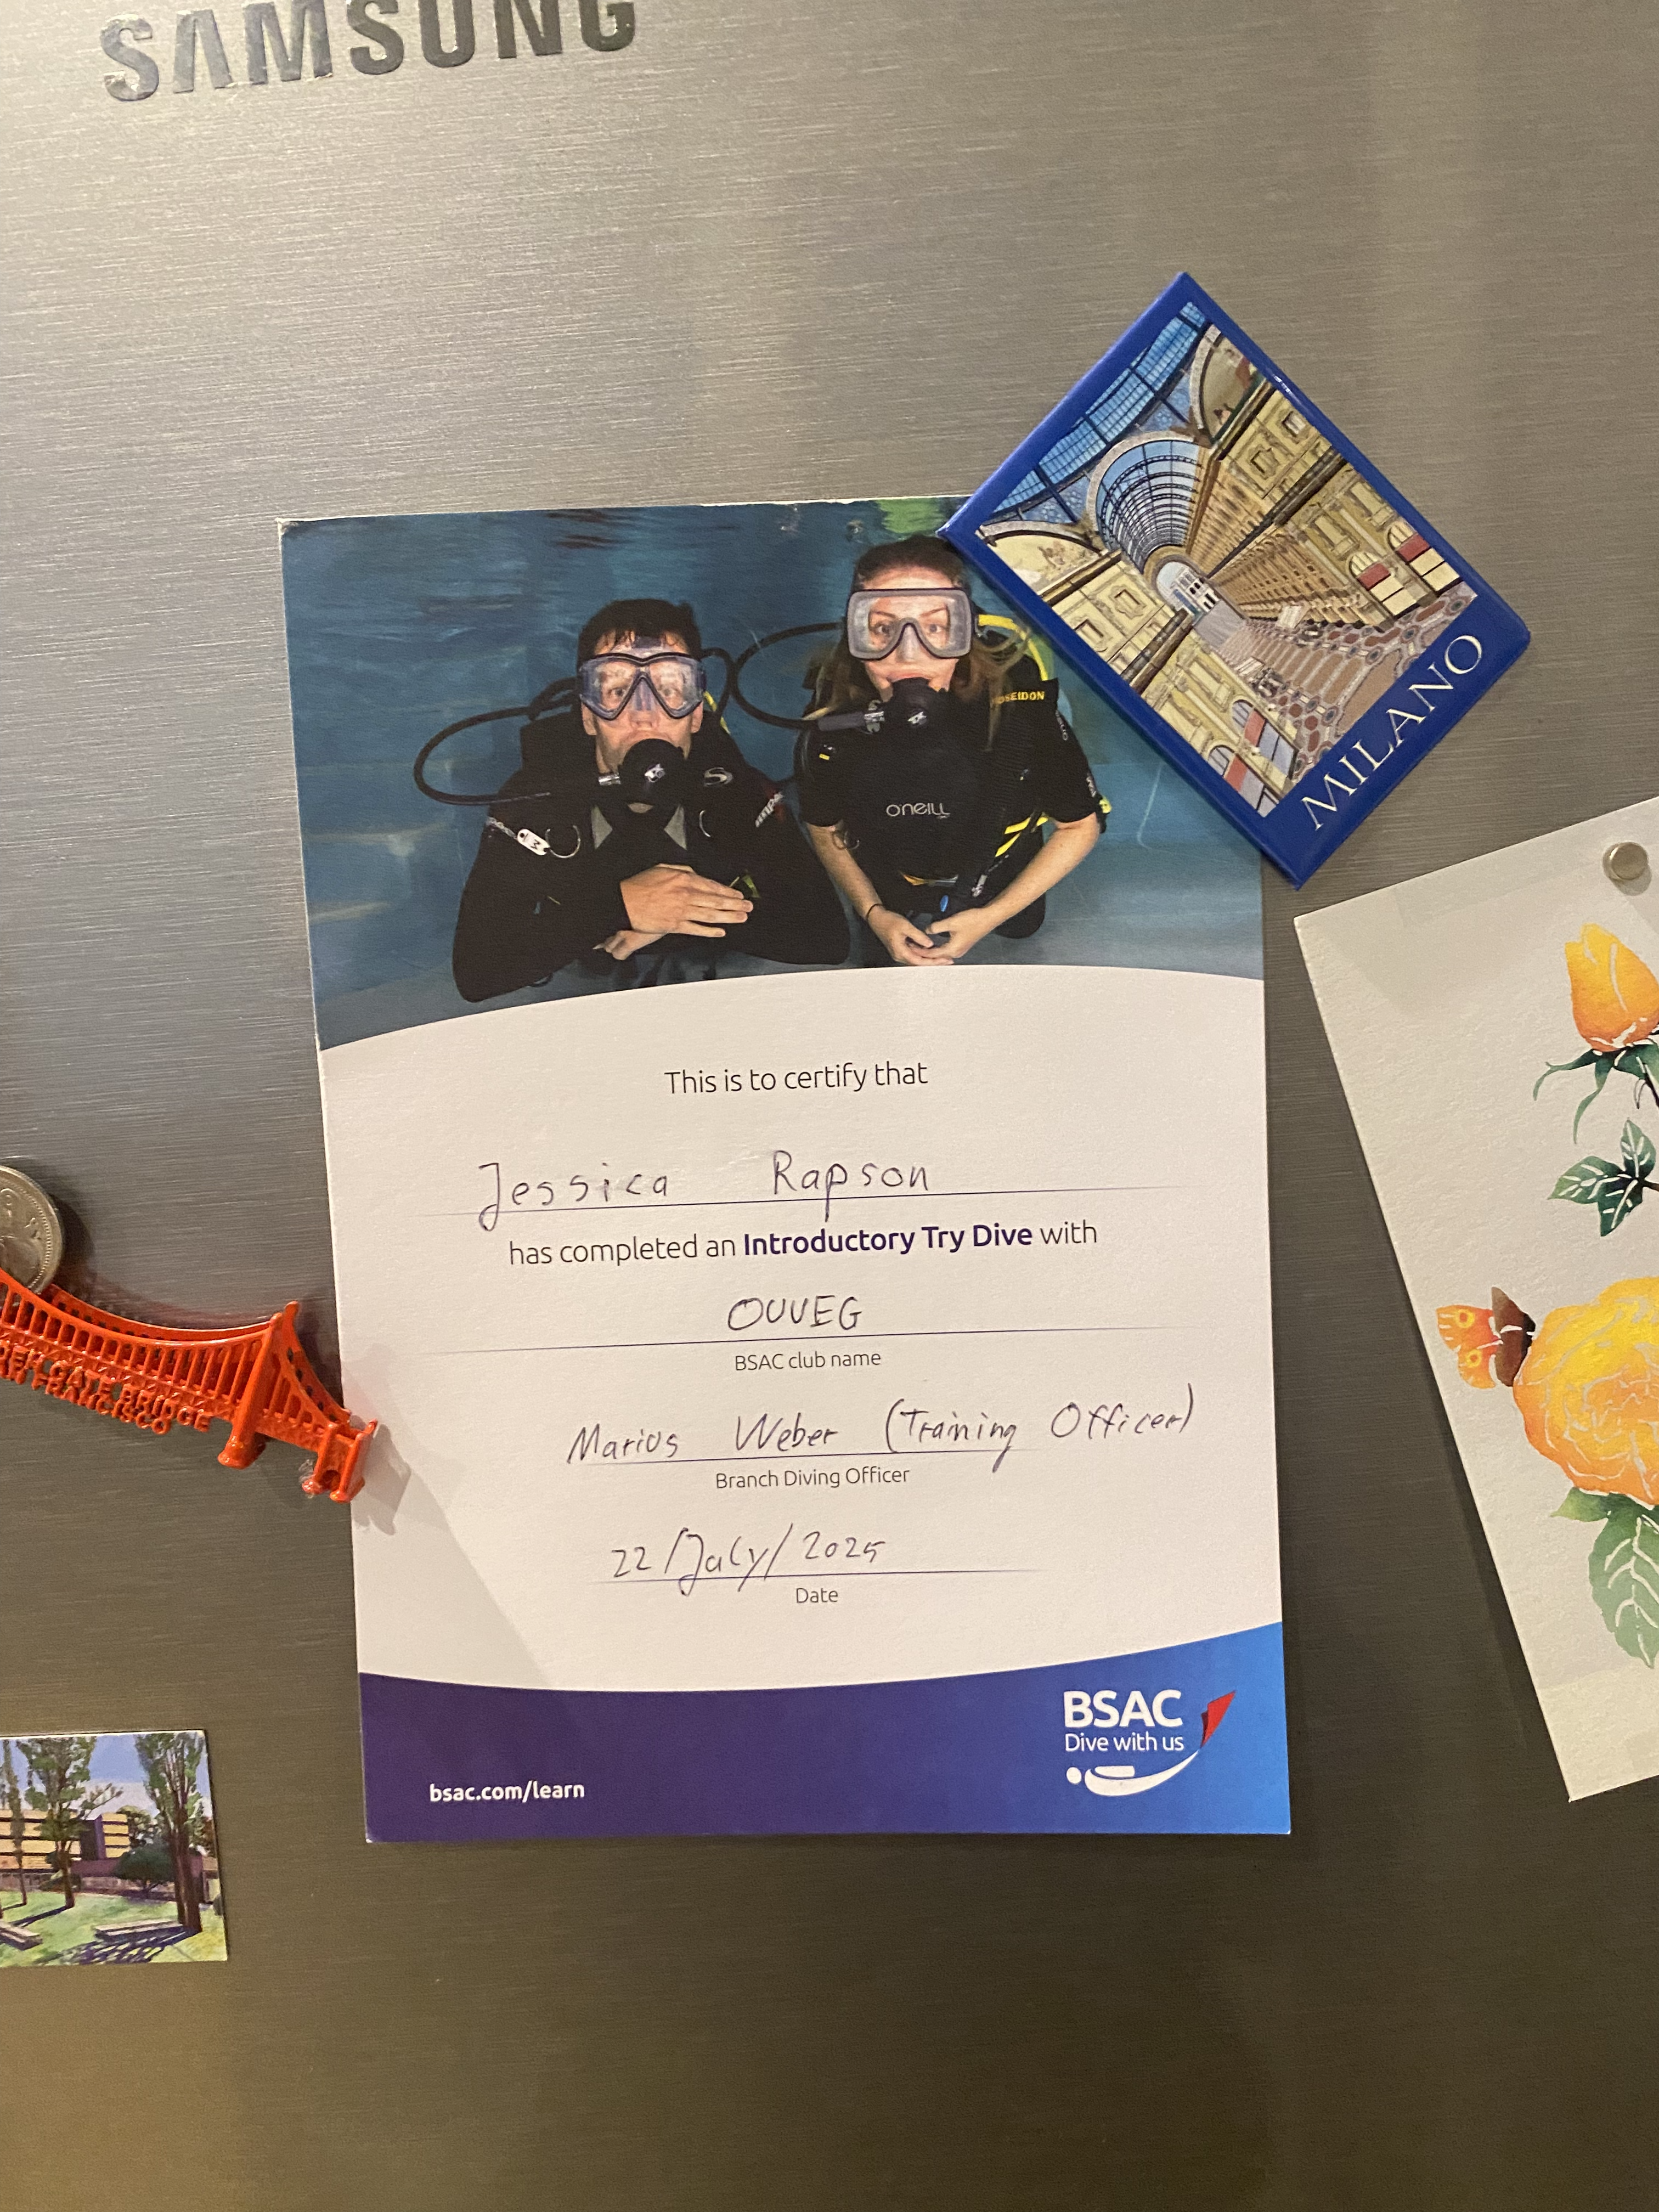 The guy who taught me said I was one of the best people to teach, since I was very hesitant originally but then learned extremely quickly.
 The rave was excellent, I would really like to go to one again. Apparently Oxford does forest raves but I’m not sure if it would be the same experience as the sound system was one of the best parts for me and I don’t think you can replicate that very well on some portable speakers outside.
Unlike others I have been going to life drawing with, I have been heavily modifying my technique based on his advice (instead of just doing the same thing over and over again), so I think I have probably had the largest change in ability.
 A five minute drawing, now getting better at seeing the shadows and forms (the trick is to not draw people as solid cartoon lines).
 My best life drawing so far, I even got a compliment from the instructor who rarely says anything about other’s drawings.
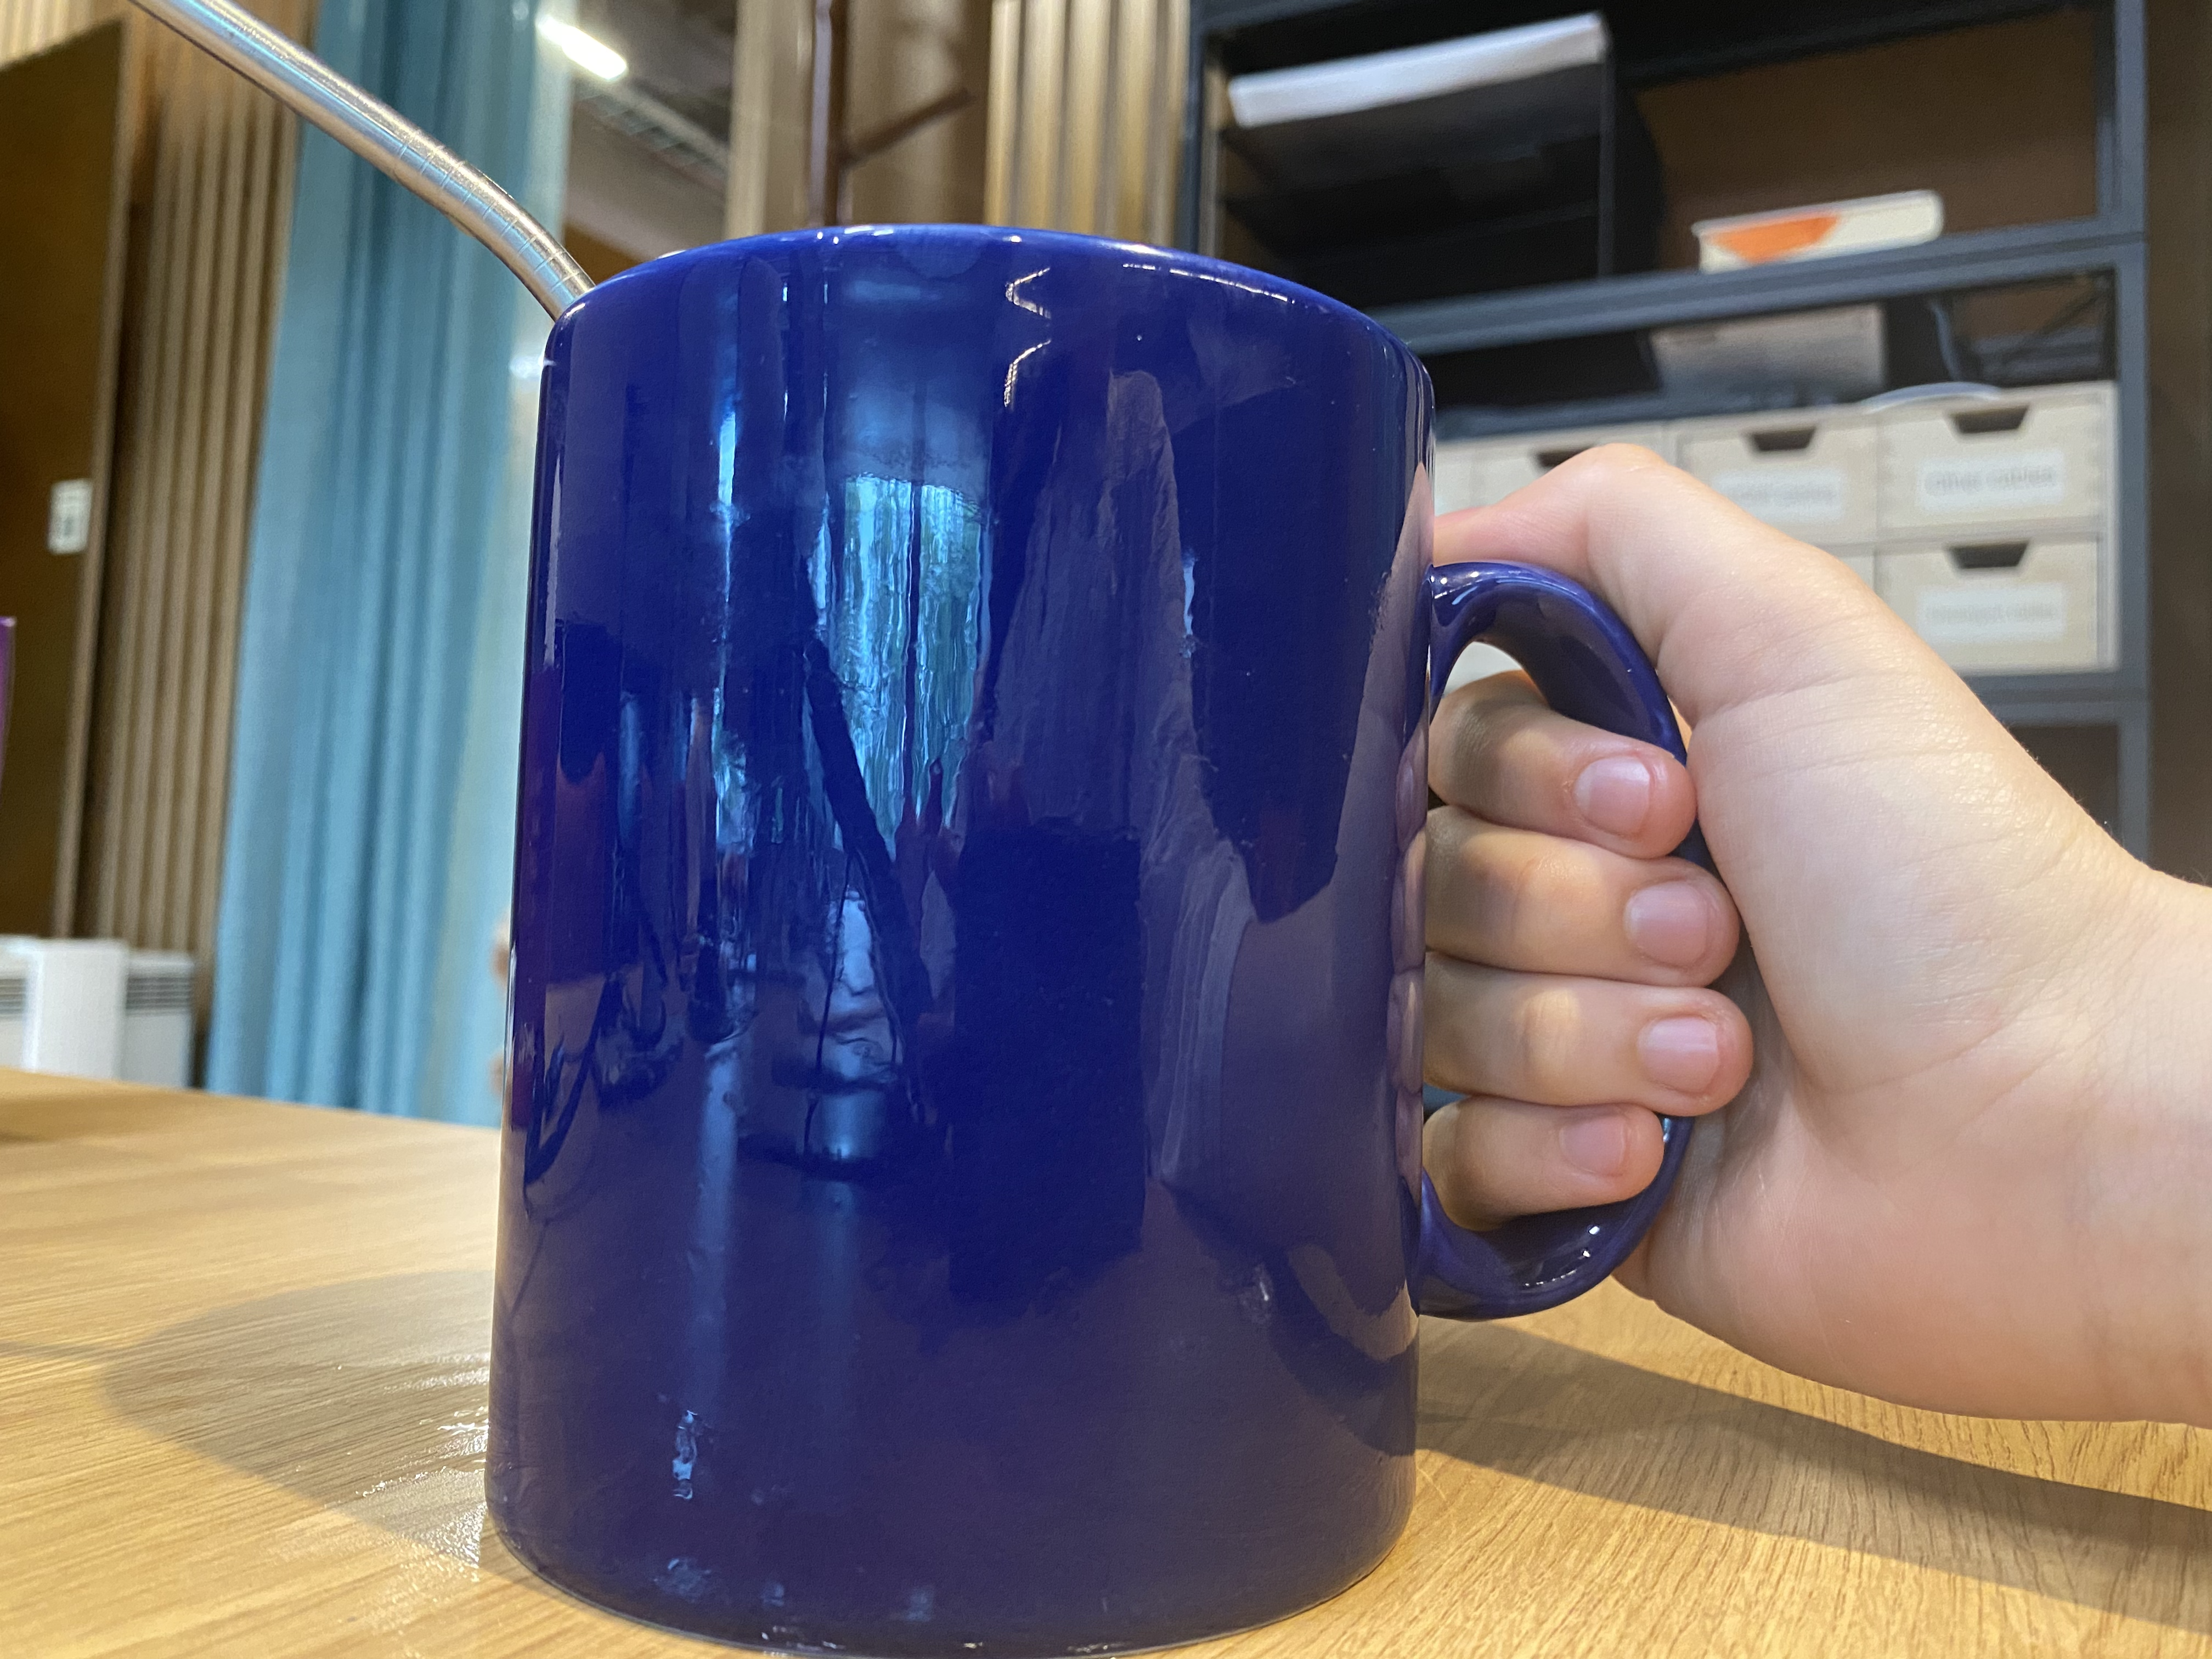 I am shamelessly addicted now. Maybe this accounts for the productivity boost?
I’ve also made a trip to London to meet up with an old friend from Toronto and have been identifying plants all over Oxford to build my own mental (and actual) database of interesting and useful plants (just for fun, since it’s not something I’ve learned much about before).
 Found another Artemisia.
 On the bus back from London, since train prices are abysmal this time of year.
 Yarrow I found in a graveyard, apparently useful for its astringent properties and mythologically used by Achilles stop bleeding.
Feels like a lot happened this month. Hopefully progress will continue, and eventually translate into quantifiable impact.