I’m back for month two! Let’s see if I can keep this up.
On Censorship and Gaza
For several years, I’ve been posting data visualisations on Reddit. Nothing special, just random findings that I’ve come across in my work that I think would benefit from public attention (examples here and here). Some of these have done quite well and have gotten quite a few interactions or made the front page. (My proportionate geological time scale is actually one of the top results when you Google “proportionate geological time scale”, which is cool.)
So given the current discourse around the war in Gaza, especially conflicting media comments on whether the civilian death toll is “typical” for similarly positioned conflicts, I decided to post a quick and simple visualisation comparing civilian deaths in the 2023 Gaza Strip invasion to other military invasions in the 21st century. Now, this topic is clearly littered with political landmines. But I figured that a simple visualisation that says nothing about moral justifications, land ownership, or the normative existence of states would be (mostly) free from such pitfalls and instead might provide some useful information to colloquial understanding of the conflict. After all, I was able to make successful data visualisation posts about nuclear energy and developed country CO2 emissions, both controversial topics, in the past. Boy was I wrong.
I’ll likely dive into the specifics of the data that I looked at in a dedicated post, but the gist of it is that I took a complete list of all 21st century invasions from Wikipedia (as cherry-picking conflicts obviously could inject bias) and compared the number of civilians deaths in the invaded region including: total number of civilian deaths, ratio of civilian deaths to militant deaths, number of civilian deaths per capita, number of civilian deaths per month, and number of civilian deaths per month per capita. I used the most cited source for every conflict cited on Wikipedia (typically the United Nations, Amnesty International, or similarly reputable international organisations) except for all of the 21st century Gaza invasions. For these, I very conservatively used the estimates provided by Israel. This was done for several reasons. Most obviously, the figures provided by the HAMAS run Gaza Ministry of Health are contentious and are especially unlikely to be believed by people who feel the Gaza invasion is justified (thus rendering the entire data discountable). Secondly, the Gaza Health Ministry figures do not distinguish between civilian and military deaths. Since the point of the visualisation was to focus on civilian deaths, this was clearly not acceptable. Thus, the data in the figure comes from the Israeli Defence Force (for the 2004 invasion of Gaza), the Israeli Ministry of Foreign Affairs (for the 2009 invasion of Gaza), and the Israeli Prime Minister (for the 2023 invasion of Gaza).
Surprisingly, the estimates provided by Netanyahu don’t actually differ that much from those provided by the Gaza Health Ministry. At the time of data collection, the Gaza Health Ministry was claiming roughly 35,000 total deaths (not distinguishing between civilians and militants) while Netanyahu claimed about 30,000 deaths of which 16,000 were civilians. It is worth noting that Netanyahu provided these estimates prior to the late May Rafah invasion and the June hostage rescue which resulted in additional civilian deaths. Regardless, this conservative estimate should be impervious to complaints that is comes from unreliable sources like HAMAS.
Numbers for the reference population (used to calculate civilian deaths per capita) are based on the population in the specific region that was invaded, not the population of the entire country. So for example, the reference population for the 2014 invasion of Ukraine was just the Donbas region, while the reference population for the 2022 invasion of Ukraine was only Southern and Eastern Ukraine. This has the effect of making the per capita civilian deaths higher than they would be if the entire country’s population was used as a reference. This helps to better measure the civilian death toll in the region that was actually under attack, making the numbers more comparable to Gaza. A more biased graph might use the entire country’s population as a reference for these invasions, thus inflating the per capita civilian death toll in Gaza by comparison.
The methodology certainly isn’t anything fancy, but I think that outlining methodology prior to looking at the results (in this case, using a precompiled list of invasions and having an automatic method for choosing the source of the civilian death estimates) means that little bias is injected to the process. I could easily see someone who is motivated to portray the civilian death toll in a certain way cherry-picking conflicts and sources of civilian deaths to suit their pre-selected narrative.
With that being said, here were the results:
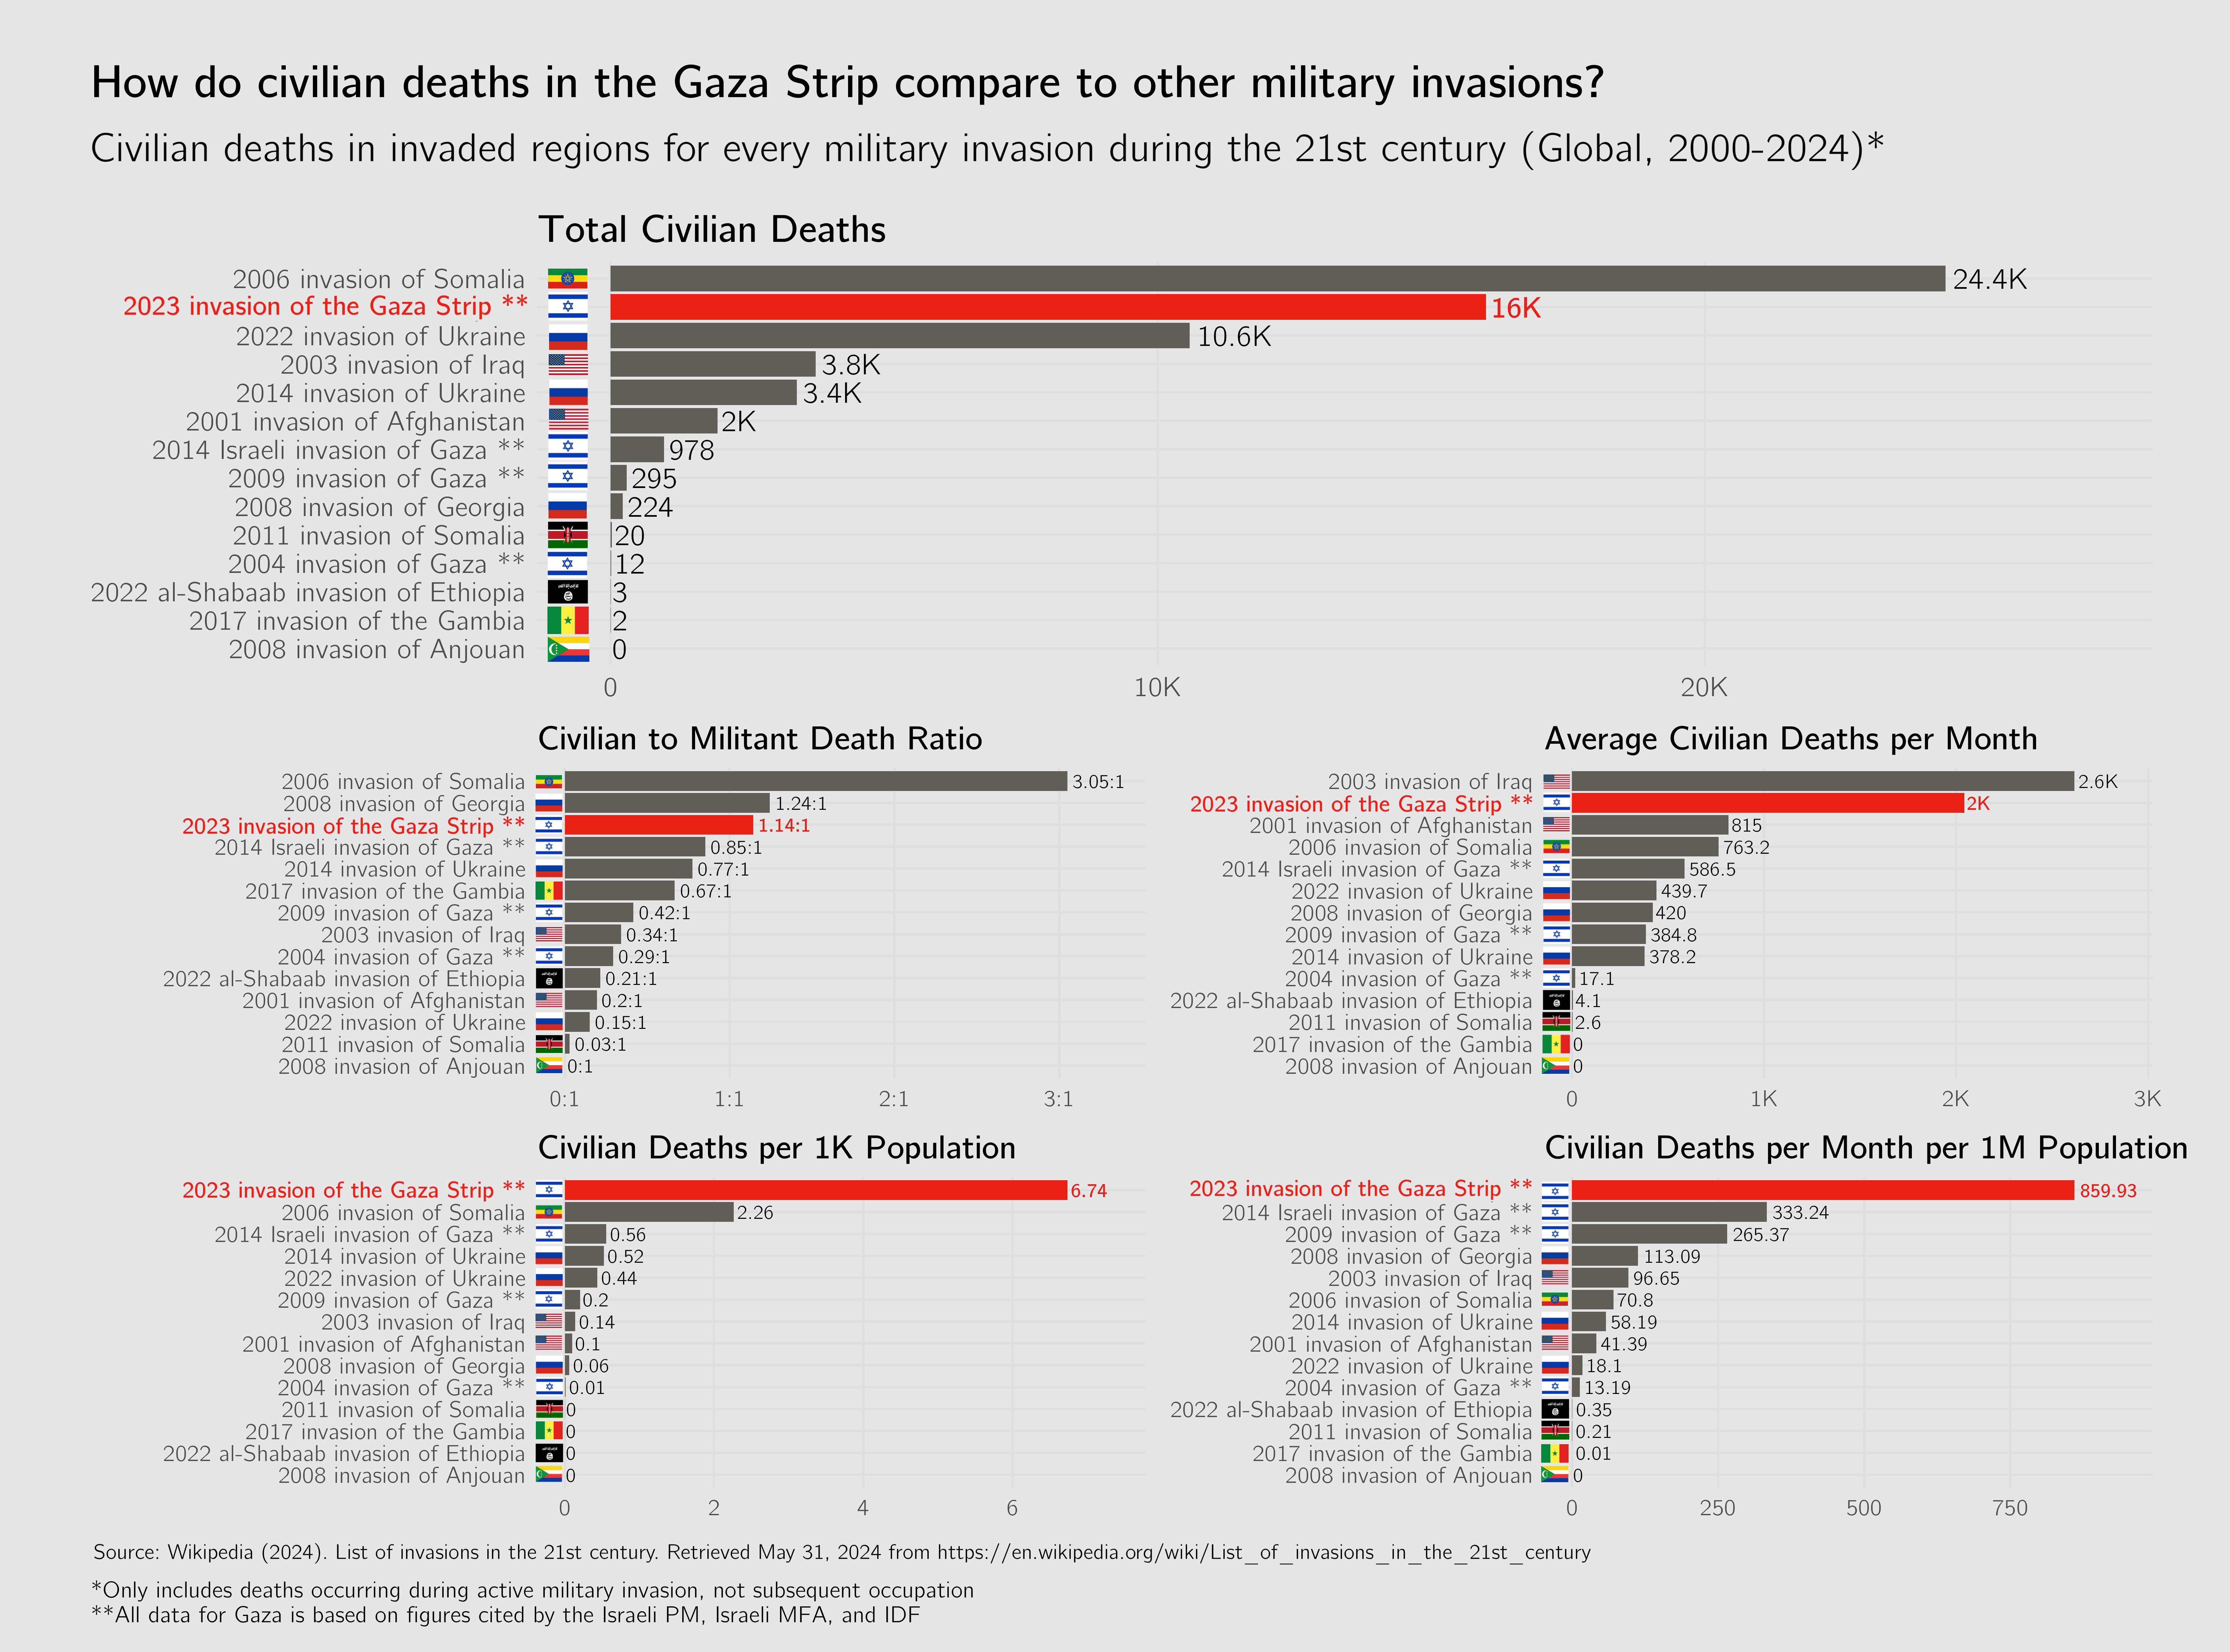 I’m not sure if many people are actually aware the the number of civilian deaths in Gaza is higher than the number of civilian deaths in Ukraine, even though the conflict has been going on for less than one year.
Contrary to what some media has been claiming, the number of civilian deaths in the Gaza Strip is very high compared to other 21st century invasions, by multiple metrics. Note that this is not a cherry-picked list of conflicts. It is literally every invasion in the 21st century.
But this still isn’t a fair portrayal of the Gaza invasion, you might say, since the Gaza Strip is an extremely dense urban population where high civilian deaths are unavoidable. Comparing conflicts like the entire Ukraine invasion simply isn’t fair, since a large portion of the conflict took place outside major urban centres where civilians were not forced to reside in the crossfire. I agree! So I also found a list of 21st century urban battles, which seems like an even better comparison. This list comes from John Spencer on the urban warfare Wikipedia page. Again, the idea was to choose a list of conflicts before looking at the data to ensure that any potential personal bias that might be injected through cherry-picking comparison battles can be avoided. Spencer lists “Fallujah, Sadr City, Mosul, Raqqa, Marawi, and now Bakhmut, Mariupol, and Khan Yunis” as the urban battles of the 21st century. I’m not sure if this is an entirely comprehensive list (e.g. it seems to be missing the Battle of Aleppo), but it seems to suffice for a third-party list that avoids accusations of cherry-picking. If anyone can point me towards a more comprehensive list, I will happily add the data to the figure.
To be consistent with comparisons, again only the most well-cited source was used for civilian death estimates (excluding Gaza, which still uses Israel’s estimates instead of those made by international organisations). They also only include deaths caused by the main attacking force. So the mass executions carried out by ISIS in Mosul, for instance, do not count as deaths caused by the coalition. However, all deaths in which the invading force was at least partially directly responsible (e.g. all the human shield-type deaths attributed to ISIS in Mosul, where the deaths were caused by coalition bombing) are included. The data from Mariupol are based on Amnesty International’s analysis of excess deaths from satellite imagery of grave sites.
The results were as follows:
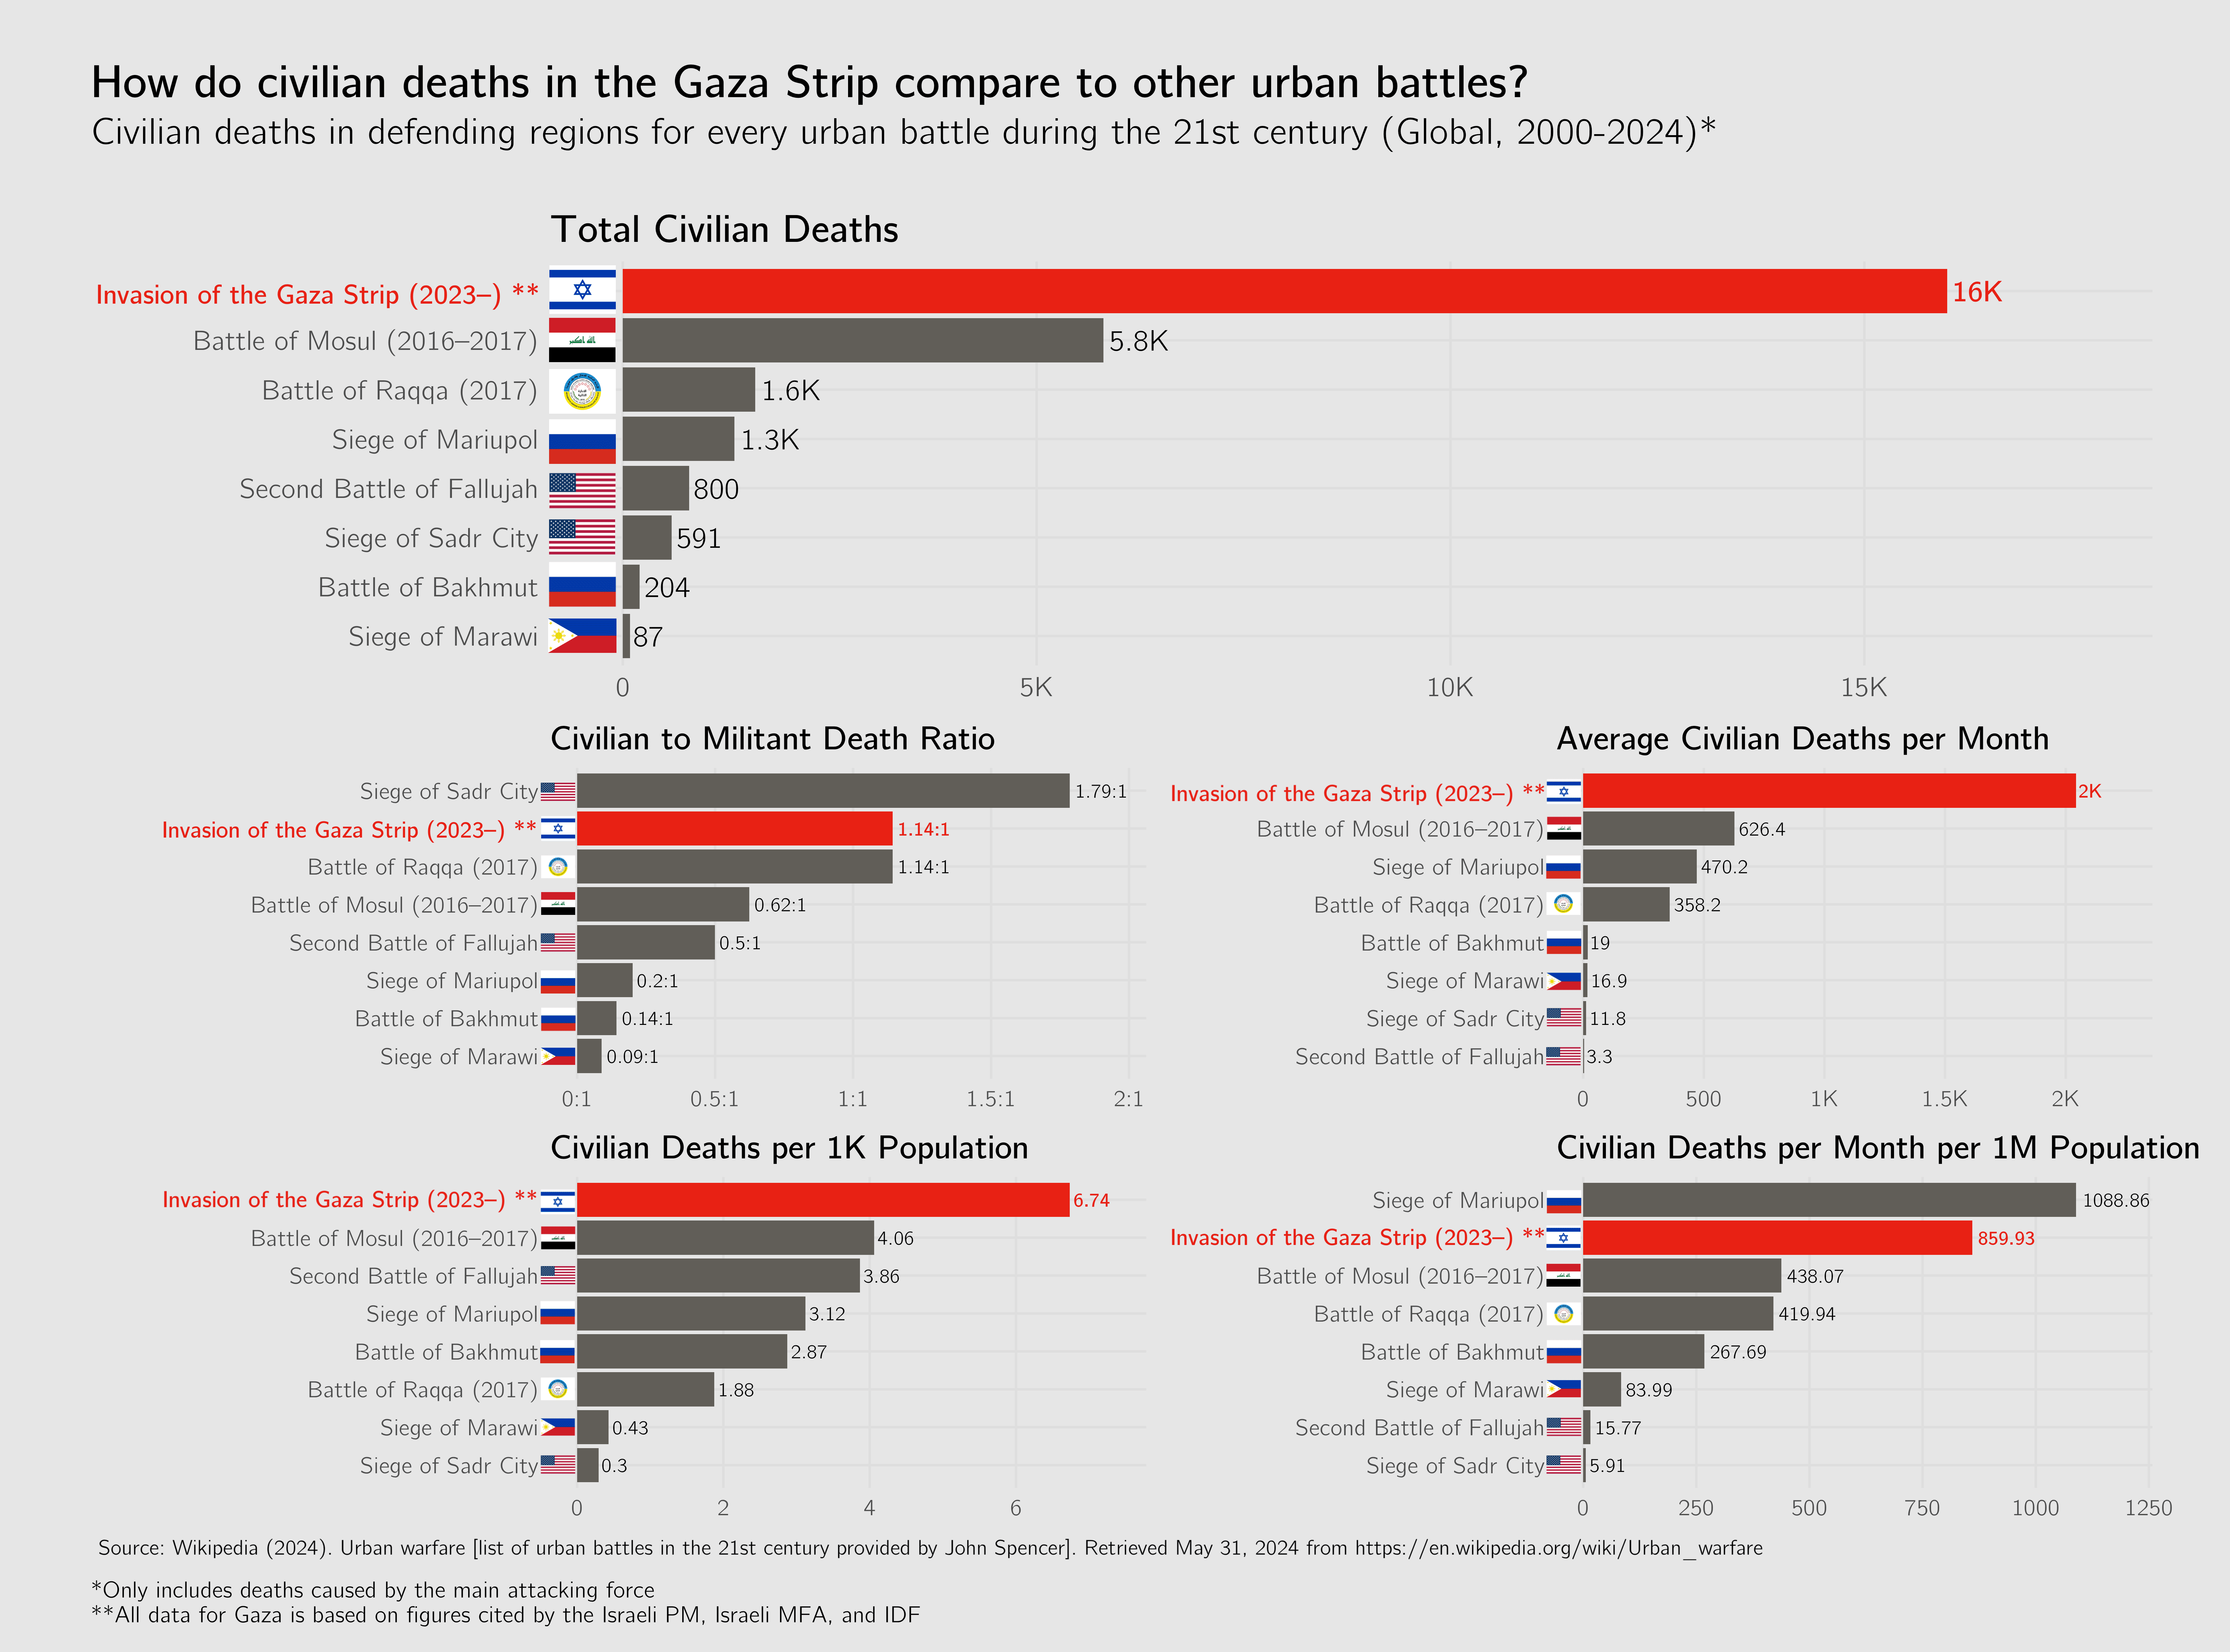 Note that these are civilian deaths, not casualties, and do not count military personnel.
Even with this additional restriction in comparison, even using the Israeli-provided civilian death estimates, the rate of civilian deaths in Gaza is extremely high compared to other model urban battles. The overall simple takeaway I think that should be made from these figures is that this is not normal.
I posted these on Reddit, and was almost immediately banned from the r/DataIsBeautiful subreddit and then was subsequently banned from the entire platform for (apparently) spreading anti-Israeli propaganda.
I was not expecting the response to my post to be without controversy, but I did not think that mods would actually step in to hide the information I was sharing. Being banned from the platform obviously makes me sad as I like posting data visualisations and generating discussion, but more importantly I was disturbed by the fact that my post was removed due to the content, and not the quality (e.g. by not citing sources properly or using misleading visualisation techniques). It was removed, it seems, because it shows the invasion of Gaza in a negative light. If you need to silence dissenting evidence, why would you think your worldview is correct?
My post, of course, was deleted so no one will be able to answer this question for me.
Main Quest
With that off my chest, I can move on to the status updates intended to be the focus of these reports. I’ve done very little to directly advance my main goals this month, I admit. I have plans for July to work on a proposal to develop an organisation that can scale up some of the work I’ve been doing, essentially advocating for and implementing effective algorithmic governance alongside government partners. I have a vague concept of potentially hosting a collaborative platform for algorithmic governance model development (e.g. hosting model tools and data and allowing experts to co-create and iterate on effective open source solutions). This naturally would require quite a bit of work and an even larger amount of collaboration. If I am being too ambitious, I will reduce the scope of what such a potential future organisation could achieve. Regardless, this will be my focus for the next while.
Thing I’ve Done
The highlight of my month has been attending the G7 Summit in Puglia. I was there as part of the G7 Research Group, where I have worked as a Senior Researcher for several years. My role is to build a machine learning model that makes predictions as to which commitments G7 leaders are most likely to follow through with following the Summit and also to provide commentary on AI-related efforts proposed by G7 leaders.
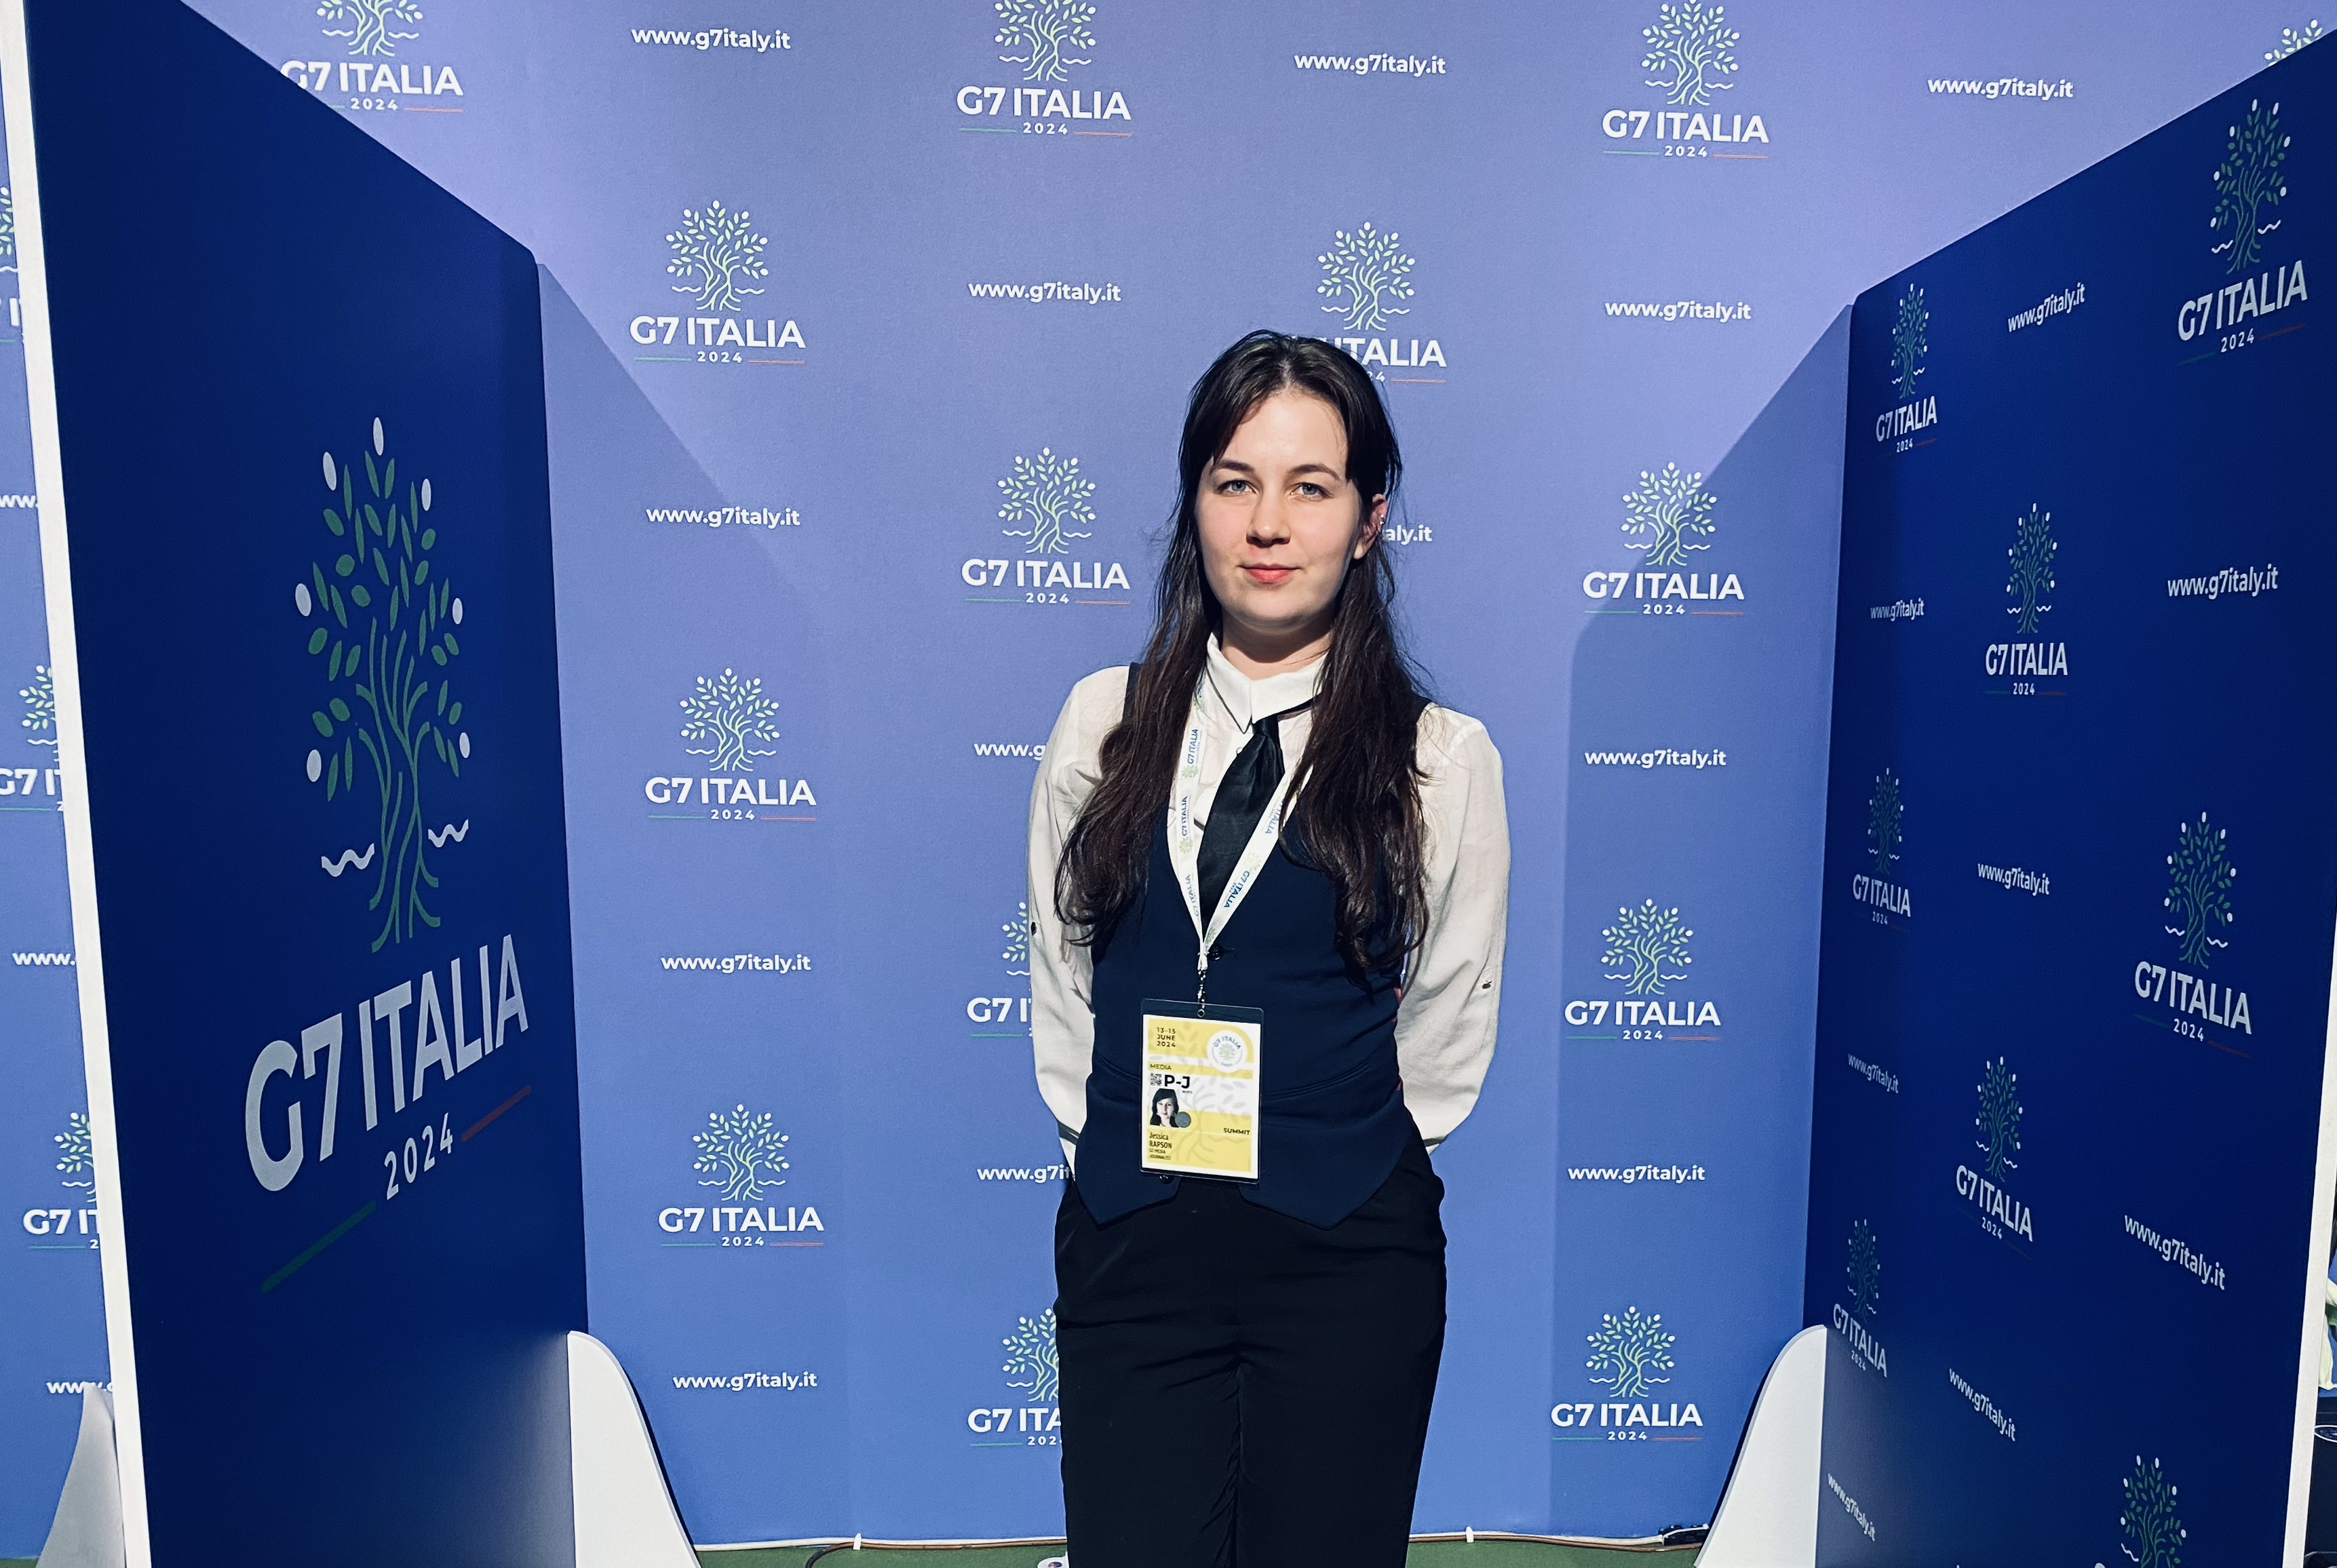 The symbol for G7 Puglia was an olive tree with seven branches representing each of the G7 members.
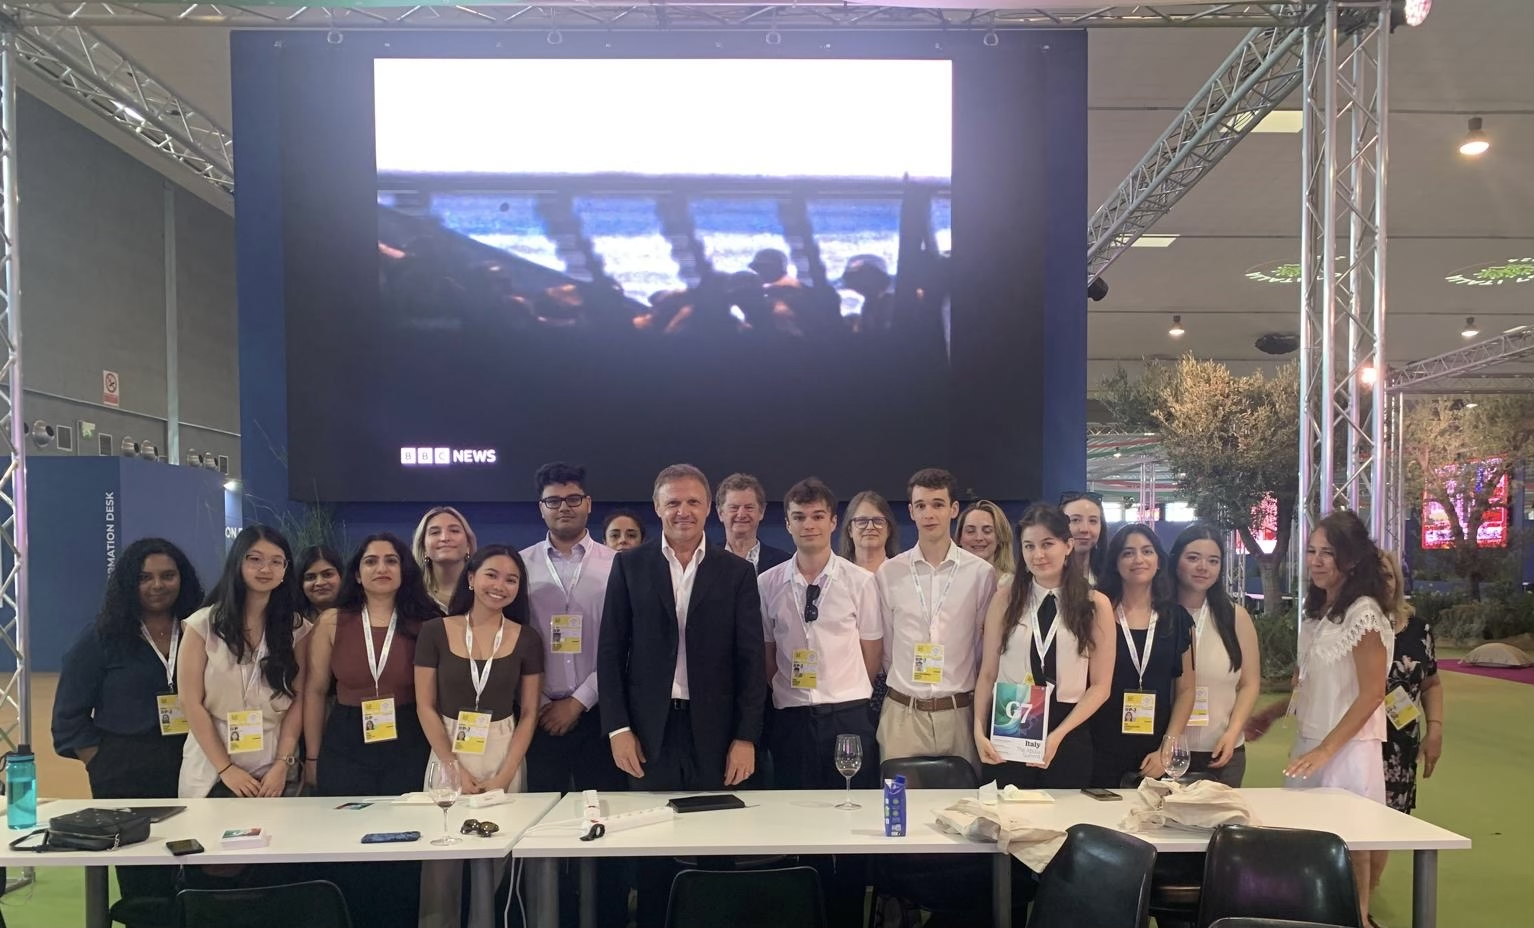 The Italian Minister of Agriculture and Giorgia Meloni’s brother-in-law, Francesco Lollobrigida.
I spent my time at the Summit adding to the model to incorporate electoral cycles as a predictor, given the upcoming legislative election in France. From this, we were able to find that changes of power in legislative or executive branches are associated with a lower probability of meeting G7 commitments.
In addition to my technical work on my model, I was interviewed by a few journalists looking for commentary on the G7’s upcoming commitments on artificial intelligence, especially given the intrigue surrounding the Pope’s AI-focused participation in the Summit. The biggest of these interviews was probably with the BBC, live on the air with Mark Lowen.
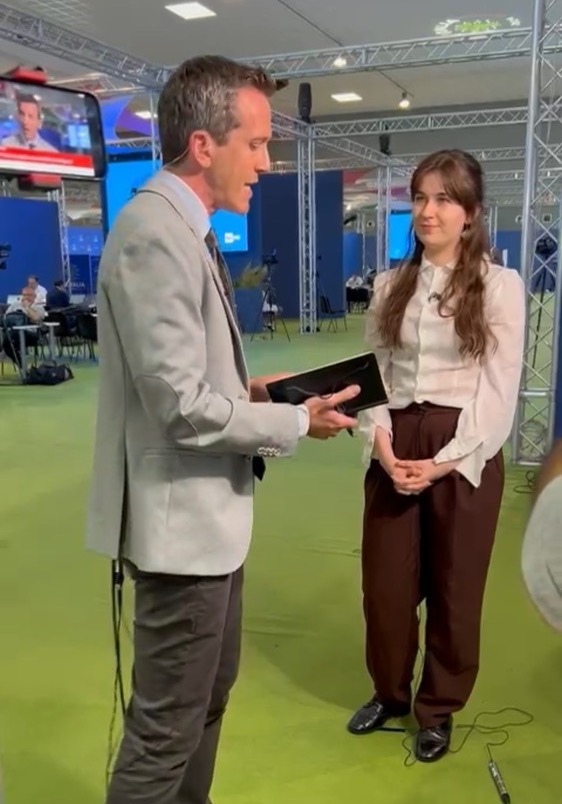
Mark Lowen was super nice, especially since my live segment was occurring almost exactly the same time as the formation of the South African coalition and we basically just had to stare into each others’ eyes until the BBC’s reporting on that breaking news was finished before beginning.
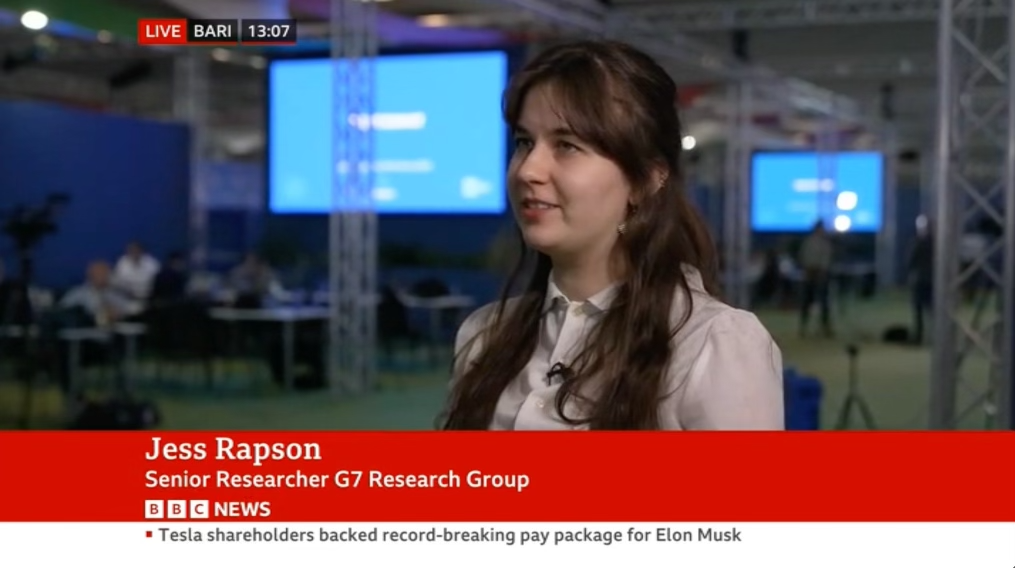 I personally find my voice pretty cringey to listen to in recordings, so I’ll leave it out of here.
It was a pretty neat experience to get interviewed live on such a prominent broadcasting channel, though I do think I could have done better. I’m not a huge fan of how fluffy the questions I was asked were (I was mainly just asked about the Pope, when I would have preferred discussing what the G7 has missed in the past regarding AI regulation and how the G7 can better achieve its commitments on AI). In the future, I think I’ll be more proactive and request the specific substantive questions that I want to talk about, or more cleverly work the conversation to focus on substance. In my interviews with print journalists, I was definitely more pushy about this.
I walked away from the Summit with a handful of new journalist and non-profit connections which I hope will come in handy in the future.
After returning from Italy, I finished up some of the projects I was working on last month. Mainly, I implemented the StormSpyder web scraping tool to the Amazon Elastic Compute Cloud, which is something I’ve always wanted to try. Basically this means that the tool can execute remotely and automatically on a regular basis. I think this is extremely useful, since it basically means the tool is implemented and fully automated, requiring no further input from me (besides fixing a few bugs here and there). I also completed my literature review on fertiliser application methods and propensity score matching for Digital Green, in the hopes of getting a write up for them on potential ways to improve crop yields in rural Bihar for next month.
I also gained a new project. Following my invitation to and attendance of an emergency flood forecasting workshop at the University of Reading, where myself and a bunch of climate scientists brainstormed new ways to better forecast flooding in the White Nile river basin in South Sudan, I completed a preliminary model using a ConvLSTM (convolutional long short-term memory) network to leverage spatio-temporal structures of past flood inundation data. Basically, the model uses the historical flood patterns, pictured below, and essentially predicts where the water will go next, using the preceding flooding patterns.

It’s very beautiful to watch the flow patterns of the Nile, breathing and pulsing as if it were a living organism.
The floods in South Sudan are of particular concern due to the extreme vulnerability of the populations living alongside the river and the extreme flood extents produced by the White Nile. Large portions of the country, including the Bentiu refugee camp, have experienced flooding for several years as unprecedented flooding in 2021 engulfed the camp and surrounding areas and never fully receded. Being able to predict the patterns of these floods in the future has the potential to improve major decisions on settlements, aid distribution, and evacuation procedures.
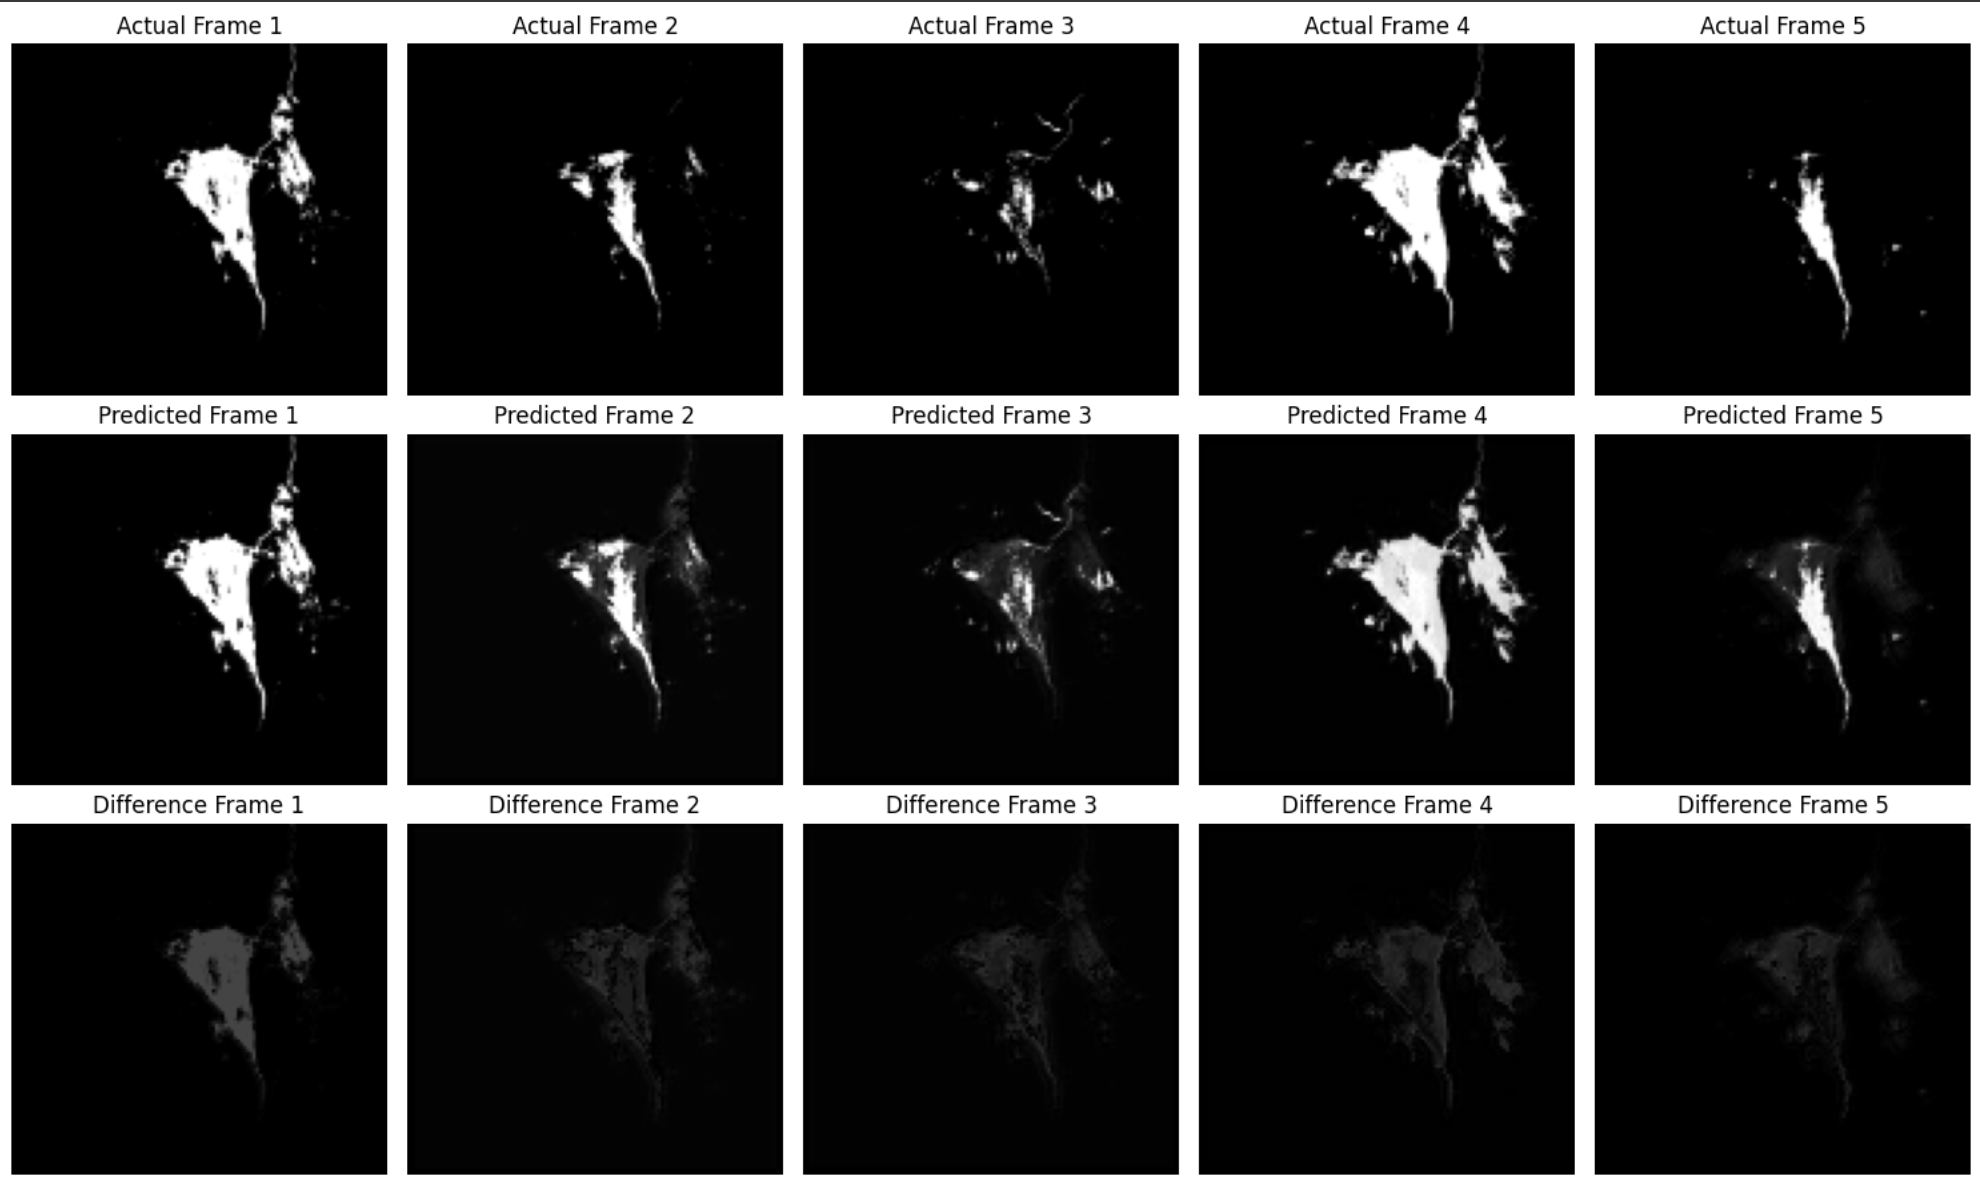 Preliminary results from my ConvLSTM model, tentatively called NileNet.
Thoughts on G7 Puglia
I have a few thoughts on the G7 Summit that I thought I’d share here, since I don’t really have any other place to put them. To many, this Summit was probably not a particularly interesting one given the level of alignment currently maintained by Western countries made the outcome of the Summit pretty much a foregone conclusion. To me though, what particularly stood out (though was not at all surprising) was the double-think seemingly employed by those present.
This was particularly salient when comparing the actions taken against Russia to those taken against Israel. Russia is a Western enemy while Israel is an ally, so the standards each country are held to are just different. Even though the number of civilian deaths is higher in Gaza, the G7 cannot even agree to utter one word of condemnation for these civilian deaths. The leaders of these countries though are meant to be self-serving so this genuinely does not shock me. Protecting Ukraine through billions in financial aid serves Europe by keeping Ukraine as a physical buffer to potential Russian aggression. Likewise, Israel provides the oft-stated “foothold in the Middle East”, in theory a steadfast ally should the United States ever need to exert military pressure on the region. What really gets to me the is the way these actions are perceived by people from these countries. I think it’s one thing to take a realism lens and acknowledge that these actions are rational, from a self-serving perspective, to Western countries. It’s something else entirely to hold the belief that these actions are done instead for fundamentally just reasons.
Another issue that got to me was the announcement of new EU tariffs on Chinese-imported electric vehicles. China has been subsidising their domestic electric vehicle industry for a few years, mainly to help boost production and make EVs competitive with ICEs (completely unrelated, China is one of the few exporters of lithium, an industry that would benefit heavily from global EV adoption). Trade incentives aside, the result of this policy is cheaper EVs and faster EV adoption, leading to a quicker transition away from CO2 emitting ICEs. By choosing to push out cheaper Chinese EVs at this time, the EU is clearly choosing protectionism over reducing emissions. Regardless of whether you think this is the correct move, the concious trade-off should be obvious.
The leader of my research group, who had been criticising China’s policies all week, praised Ontario’s decision to subsidise its own EV industry (in his words, if China is doing it then “so should we”). Strangely he doesn’t think the EU should place tariffs on Canadian EV exports… G7 leaders themselves also had the gall to criticise China for not doing enough to reduce emissions in the Puglia Communique.
I’m going to work a bit this month to try and quantify what the potential impact of these tariffs could be on European emissions, adding to the climate policy simulator my students were working on in May. Hopefully this can provide a better picture of what this trade-off costs in terms of emissions.
I personally found the G20 much more interesting given the pushback from non-Western G20 members on these types of issues. The conversations with Indian journalists were also much more enlightening (and critical) than the conversations with G7 country journalists here. In all, I left feeling disappointed. I’ve declared my Chinese word of the month to be 虚伪 (xūwèi), hypocritical. 虚 (xū) means “empty” and 伪 (wèi) means “fake”.
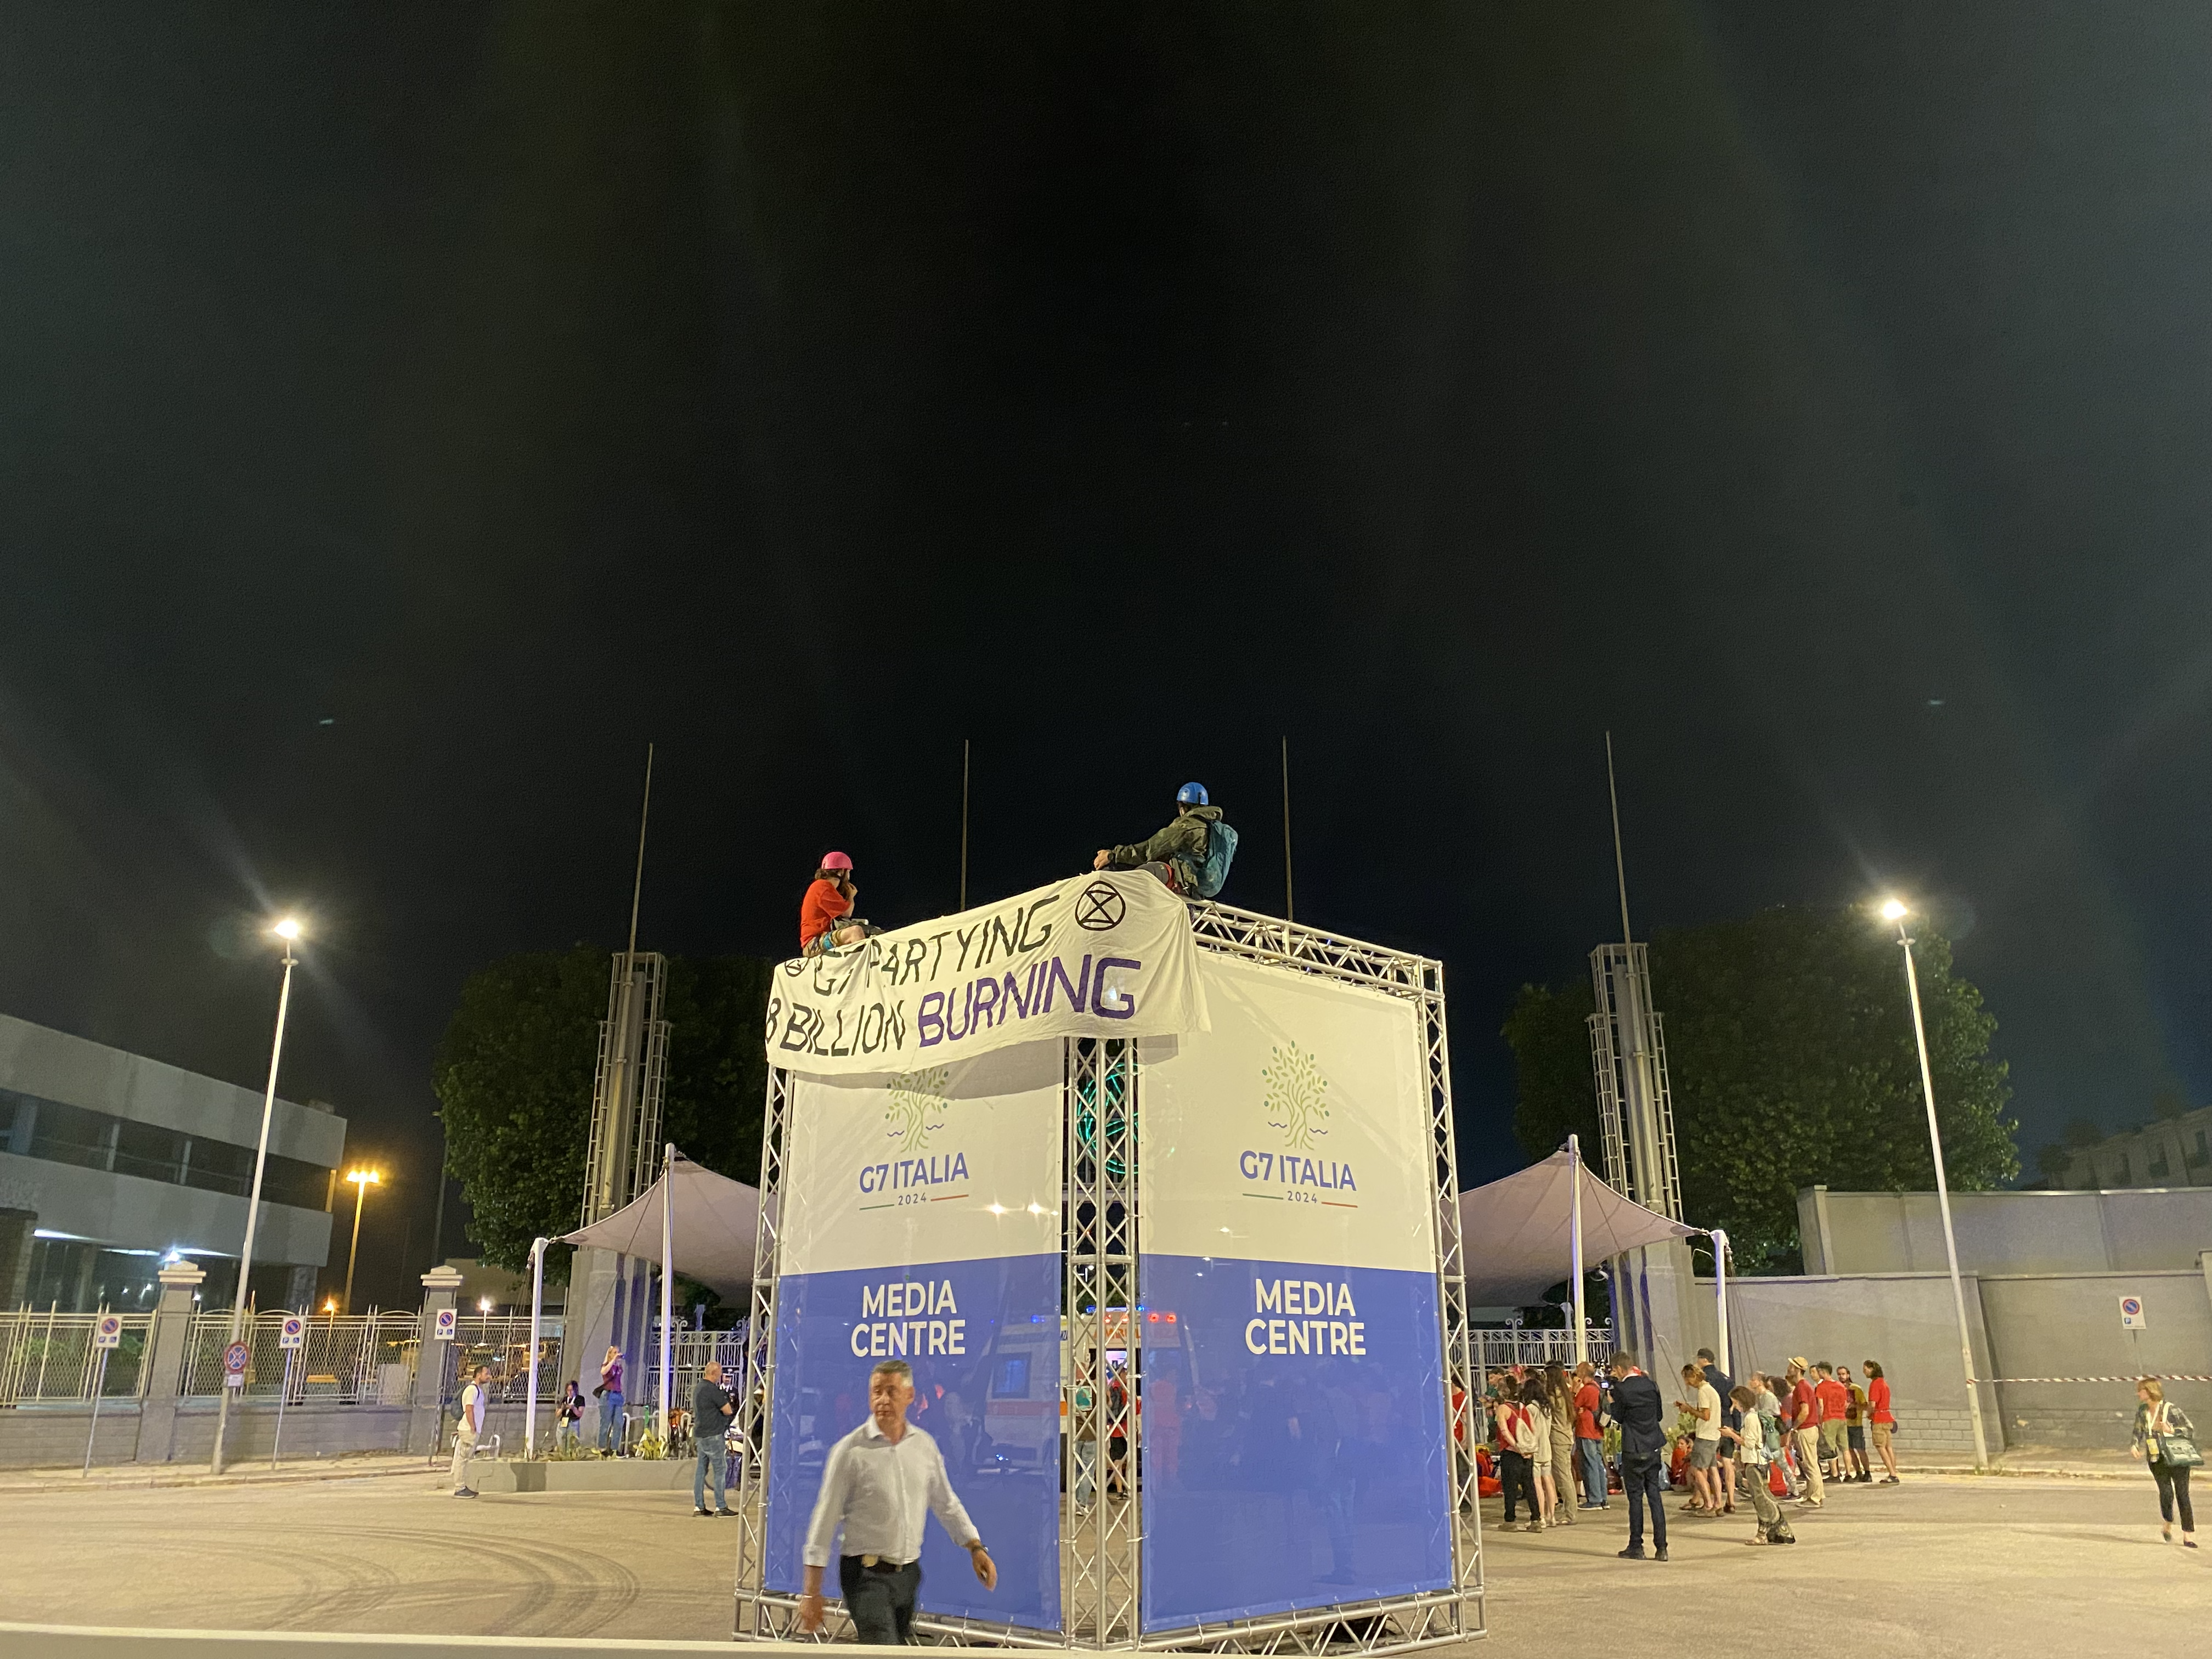 Extinction Rebellion showed up to protest at the Media Centre. Italian police injured one of the protestors who chained themself to the fence by pulling their neck constraint. When we left the protestor was being taken away by an ambulance.
On a more superficial note, wow Biden looked awful. He constantly seemed to be wandering off in random directions and had to be gently redirected by Meloni or one of the Italian aids back onto the stage or into the group photograph. It also looked like the other leaders were not giving him much notice, basically shaking his hand and smiling at him but not really speaking with him as an equal as they did with other leaders – kind of like how you might treat a senile but respected older member of the family. Not a great look for the upcoming elections.
Travel, Life, and Other Stuff
Aside from work, life continues to yield interesting things to learn and do. While in Italy for the Summit, I had a chance to take a stab at learning some Italian. In just the one week I was there, I managed to get 73 Italian words and phrases to a recall level. After struggling with Chinese for so long, it was a breath of fresh air to mess around with a Latin-root language. Knowing French makes learning these so much easier. For Chinese, it probably took me over a month to get to the point where I could confidently recall over 70 words.
In the one and a half days after the summit, I got to briefly explore Bari. I saw Santa Claus, the old town, and Rigoletto.
 Santa! They keep his body parts in the basement.
 The Bari old town, Barivecchia, is absolutely adorable – especially if you ignore the high speed road that encircles it on all sides.
 Verdi was required to make major changes to Rigoletto to avoid any appearance of criticising the monarchy. All the place names and family names are carefully chosen to be places and bloodlines that no longer exist.
Back in Oxford, I took a stab a sewing a sleeve back onto a dress I purchased in Naran Tuul, making this my first (successful!) attempt at sewing clothes. I also messed around biking in the Cotswalds
 Success!
 Attended Oxford Pride, which is extremely small and also held at 10 in the morning.
 A true “ford” in Lower Slaughter.
 We found the alleged inspiration for Tolkien’s Doors of Durin.
For reading, I’ve been listening to a few audio books while I do other things. I’ve completed Dracula and am currently listening to Babel (narrated by Chris Lew Kum Hoi, who is almost unbelievably good at reading the variety of languages and accents represented in the book).
Overall, I’m pretty happy with my work this month, even if I haven’t made any direct steps towards my main quest goals. I think scaling up the work I am currently doing will be quite difficult and will require me to have a large amount of connections, experience, and completed jobs under my belt so everything I’m doing now counts towards that, even if indirectly.